added 294 characters in body
Source Link
Domen
  • 33.4k
  • 3
  • 47
  • 66
letter = "π";
(* Shift from the rotation axis *)
shift = {3, 0};
(* Drawing canvas size *)
cs = 10;

(* Discretize boundary *)
reg = BoundaryDiscretizeGraphics[
   ImportString[ExportString[Text[Style[letter, FontFamily -> "Cambria"]], 
      "PDF"], {"PDF", "PageGraphics"}, "TextOutlines" -> True][[1, 1, 2]], 
    MaxCellMeasure -> .01];

(* Obtain boundary points *)
pts = Normal@GraphicsComplex[MeshCoordinates[reg], MeshCells[reg, 1]] /. 
   Line[{p1_, _}] :> p1 + shift;

(* Calculate natural parameter *)
phi = Accumulate[EuclideanDistance @@ # & /@ Partition[pts, 2, 1, {1, 1}]]/Perimeter[reg];

(* Merge points with the parameter *)
pts2D = Transpose[Transpose[pts]~Join~{phi}];

(* Construct 3D curve *)
pts3D[δ_] = RotationTransform[2 π #[[3]] + δ, {0, 0, 1}][{#[[1]], 0, #[[2]]}] & /@ pts2D;

(* Construct 2D interpolated curve *)
curve2D = Interpolation[{#[[3]], {#[[1]], 0, #[[2]]}} & /@ (pts2D /. δ -> 0)];

Animate[With[{δ = δ}, 
  Quiet@Show[
    Graphics3D[{Thick, Darker@Green, Line@pts3D[-2  π   δ], 
       PointSize[Large], Red, Ball[curve2D[δ], .25], 
      Opacity[.75], White, 
      Polygon[{{0, 0, 0}, {cs, 0, 0}, {cs, 0, cs}, {0, 0, cs}}]}, Boxed
     Background -> FalseBlack, 
  Boxed -> False, BoxRatios -> {2, 2, 1}, 
     Lighting -> {{"Ambient", White}}, 
     Axes -> True, 
     AxesOrigin -> {0, 0, 0}, Ticks -> None, 
     PlotRange -> {{-cs, cs}, {-cs, cs}, {0, cs}}, 
     ViewMatrix -> {{{0.046, 0.019, 0., 0.002}, {-0.004, 0.01, 
         0.049, -0.244}, {-0.018, 0.045, -0.011, 3.439}, {0., 0., 0., 
         1.}}, {{3.558, 0., 0.5, 0.}, {0., 3.558, 0.5, 0.}, {0., 0., 
         2.954, -7.96}, {0., 0., 1., 0.}}}], 
    ParametricPlot3D[curve2D[t], {t, 0, δ + $MachineEpsilon}, 
     PlotStyle -> {Red, Thick}], ImageSize -> {400, 300}]], {δ,0, 1}]
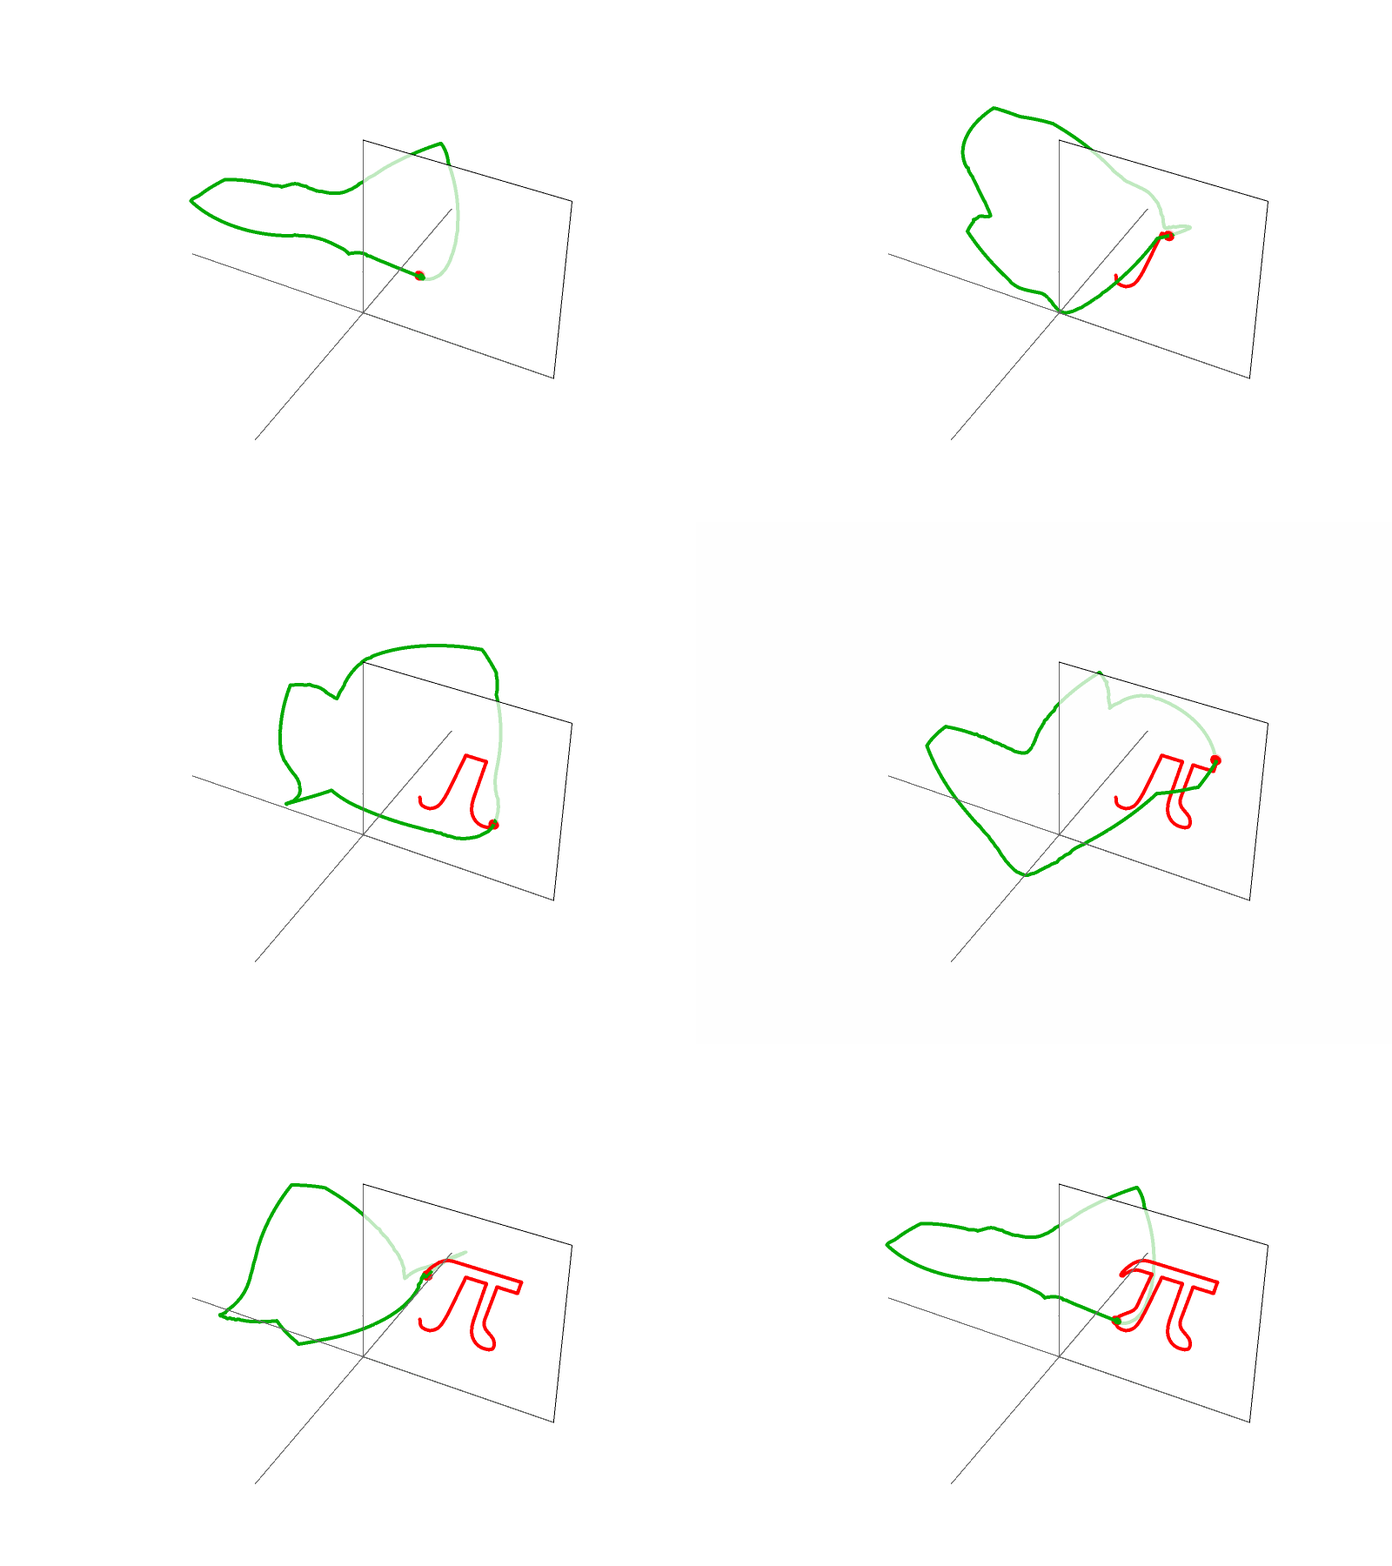
enter image description hereenter image description here

letter = "π";
(* Shift from the rotation axis *)
shift = {3, 0};
(* Drawing canvas size *)
cs = 10;

(* Discretize boundary *)
reg = BoundaryDiscretizeGraphics[
   ImportString[ExportString[Text[Style[letter, FontFamily -> "Cambria"]], 
      "PDF"], {"PDF", "PageGraphics"}, "TextOutlines" -> True][[1, 1, 2]], 
    MaxCellMeasure -> .01];

(* Obtain boundary points *)
pts = Normal@GraphicsComplex[MeshCoordinates[reg], MeshCells[reg, 1]] /. 
   Line[{p1_, _}] :> p1 + shift;

(* Calculate natural parameter *)
phi = Accumulate[EuclideanDistance @@ # & /@ Partition[pts, 2, 1, {1, 1}]]/Perimeter[reg];

(* Merge points with the parameter *)
pts2D = Transpose[Transpose[pts]~Join~{phi}];

(* Construct 3D curve *)
pts3D[δ_] = RotationTransform[2 π #[[3]] + δ, {0, 0, 1}][{#[[1]], 0, #[[2]]}] & /@ pts2D;

(* Construct 2D interpolated curve *)
curve2D = Interpolation[{#[[3]], {#[[1]], 0, #[[2]]}} & /@ (pts2D /. δ -> 0)];

Animate[With[{δ = δ}, Quiet@Show[
    Graphics3D[{Thick, Darker@Green, Line@pts3D[-2 π  δ], 
      PointSize[Large], Red, Ball[curve2D[δ], .25], Opacity[.75], White, 
      Polygon[{{0, 0, 0}, {cs, 0, 0}, {cs, 0, cs}, {0, 0, cs}}]}, Boxed -> False, 
     BoxRatios -> {2, 2, 1}, Lighting -> {{"Ambient", White}}, 
     Axes -> True, AxesOrigin -> {0, 0, 0}, Ticks -> None, 
     PlotRange -> {{-cs, cs}, {-cs, cs}, {0, cs}}], 
    ParametricPlot3D[curve2D[t], {t, 0, δ + $MachineEpsilon}, 
     PlotStyle -> {Red, Thick}], ImageSize -> {400, 300}]], {δ,0, 1}]
enter image description here

letter = "π";
(* Shift from the rotation axis *)
shift = {3, 0};
(* Drawing canvas size *)
cs = 10;

(* Discretize boundary *)
reg = BoundaryDiscretizeGraphics[
   ImportString[ExportString[Text[Style[letter, FontFamily -> "Cambria"]], 
      "PDF"], {"PDF", "PageGraphics"}, "TextOutlines" -> True][[1, 1, 2]], 
    MaxCellMeasure -> .01];

(* Obtain boundary points *)
pts = Normal@GraphicsComplex[MeshCoordinates[reg], MeshCells[reg, 1]] /. 
   Line[{p1_, _}] :> p1 + shift;

(* Calculate natural parameter *)
phi = Accumulate[EuclideanDistance @@ # & /@ Partition[pts, 2, 1, {1, 1}]]/Perimeter[reg];

(* Merge points with the parameter *)
pts2D = Transpose[Transpose[pts]~Join~{phi}];

(* Construct 3D curve *)
pts3D[δ_] = RotationTransform[2 π #[[3]] + δ, {0, 0, 1}][{#[[1]], 0, #[[2]]}] & /@ pts2D;

(* Construct 2D interpolated curve *)
curve2D = Interpolation[{#[[3]], {#[[1]], 0, #[[2]]}} & /@ (pts2D /. δ -> 0)];

Animate[With[{δ = δ}, 
  Quiet@Show[
    Graphics3D[{Thick, Darker@Green, Line@pts3D[-2  π   δ],
       PointSize[Large], Red, Ball[curve2D[δ], .25], 
      Opacity[.75], White, 
      Polygon[{{0, 0, 0}, {cs, 0, 0}, {cs, 0, cs}, {0, 0, cs}}]}, 
     Background -> Black, Boxed -> False, BoxRatios -> {2, 2, 1}, 
     Lighting -> {{"Ambient", White}}, Axes -> True, 
     AxesOrigin -> {0, 0, 0}, Ticks -> None, 
     PlotRange -> {{-cs, cs}, {-cs, cs}, {0, cs}}, 
     ViewMatrix -> {{{0.046, 0.019, 0., 0.002}, {-0.004, 0.01, 
         0.049, -0.244}, {-0.018, 0.045, -0.011, 3.439}, {0., 0., 0., 
         1.}}, {{3.558, 0., 0.5, 0.}, {0., 3.558, 0.5, 0.}, {0., 0., 
         2.954, -7.96}, {0., 0., 1., 0.}}}], 
    ParametricPlot3D[curve2D[t], {t, 0, δ + $MachineEpsilon}, 
     PlotStyle -> {Red, Thick}], ImageSize -> {400, 300}]], {δ,0, 1}]

enter image description here

Source Link
Domen
  • 33.4k
  • 3
  • 47
  • 66

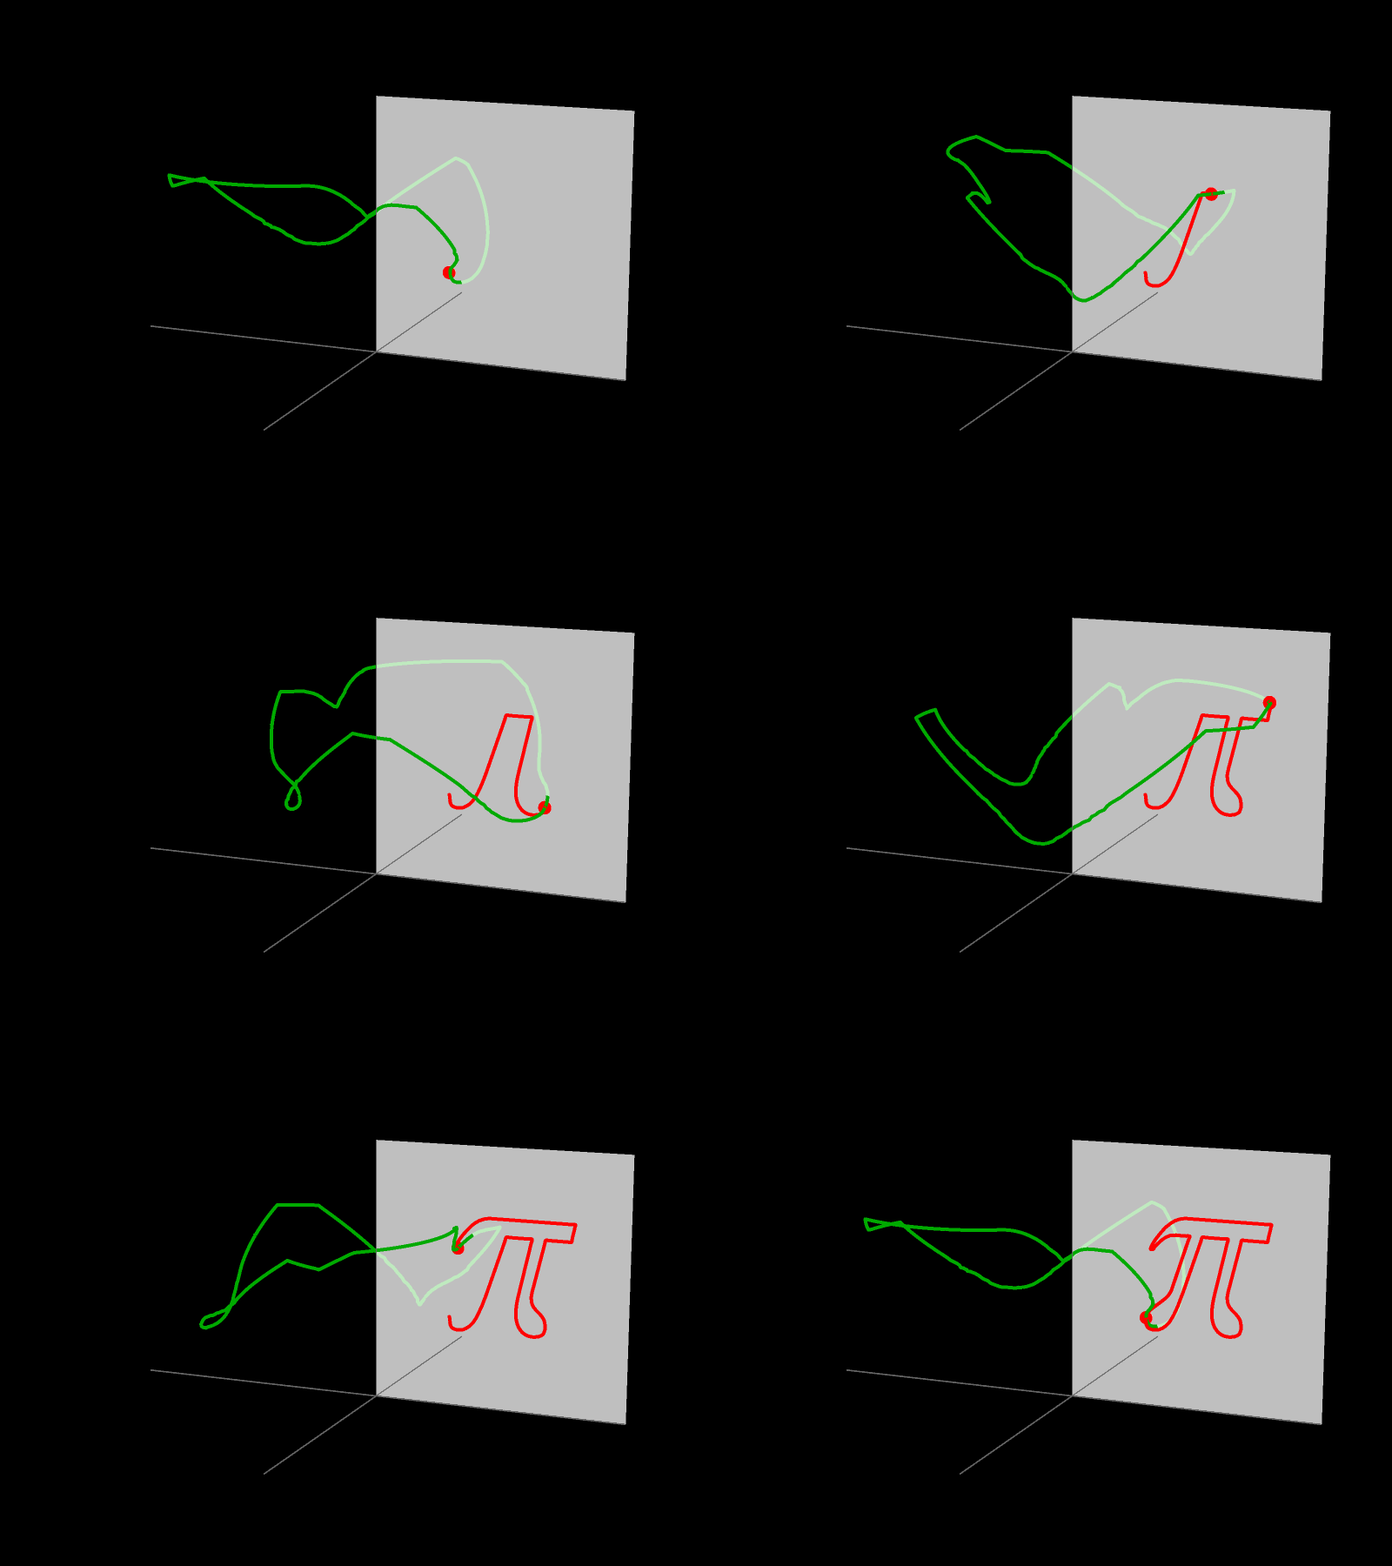
Here is an example of an implementation. First, we get the discretized boundary of the letter (thanks to @cvgmt). Then we calculate the natural parametrization of the boundary curve and construct the corresponding 3D curve.

letter = "π";
(* Shift from the rotation axis *)
shift = {3, 0};
(* Drawing canvas size *)
cs = 10;

(* Discretize boundary *)
reg = BoundaryDiscretizeGraphics[
   ImportString[ExportString[Text[Style[letter, FontFamily -> "Cambria"]], 
      "PDF"], {"PDF", "PageGraphics"}, "TextOutlines" -> True][[1, 1, 2]], 
    MaxCellMeasure -> .01];

(* Obtain boundary points *)
pts = Normal@GraphicsComplex[MeshCoordinates[reg], MeshCells[reg, 1]] /. 
   Line[{p1_, _}] :> p1 + shift;

(* Calculate natural parameter *)
phi = Accumulate[EuclideanDistance @@ # & /@ Partition[pts, 2, 1, {1, 1}]]/Perimeter[reg];

(* Merge points with the parameter *)
pts2D = Transpose[Transpose[pts]~Join~{phi}];

(* Construct 3D curve *)
pts3D[δ_] = RotationTransform[2 π #[[3]] + δ, {0, 0, 1}][{#[[1]], 0, #[[2]]}] & /@ pts2D;

(* Construct 2D interpolated curve *)
curve2D = Interpolation[{#[[3]], {#[[1]], 0, #[[2]]}} & /@ (pts2D /. δ -> 0)];

Animate[With[{δ = δ}, Quiet@Show[
    Graphics3D[{Thick, Darker@Green, Line@pts3D[-2 π  δ], 
      PointSize[Large], Red, Ball[curve2D[δ], .25], Opacity[.75], White, 
      Polygon[{{0, 0, 0}, {cs, 0, 0}, {cs, 0, cs}, {0, 0, cs}}]}, Boxed -> False, 
     BoxRatios -> {2, 2, 1}, Lighting -> {{"Ambient", White}}, 
     Axes -> True, AxesOrigin -> {0, 0, 0}, Ticks -> None, 
     PlotRange -> {{-cs, cs}, {-cs, cs}, {0, cs}}], 
    ParametricPlot3D[curve2D[t], {t, 0, δ + $MachineEpsilon}, 
     PlotStyle -> {Red, Thick}], ImageSize -> {400, 300}]], {δ,0, 1}]

enter image description here