added another method
Source Link
codebpr
  • 3k
  • 1
  • 8
  • 28

Method 1 : Using Bode Plot from signals and systems

One more direct solution can be by making use of Mathematica's inbuilt BodePlot. You just need to find the Transfer function, which can be easily found in your equation by taking the Laplace Transform on both sides of the equation and is given as:

H[s_] := 1/(s^2 + 2 \[Zeta]  s + 1)

Now, use the BodePlot function, just for Phase by this code:

BodePlot[1/(s^2 + 2 (#)  s + 1) & /@ {0.005, 0.1, 0.38, 1}, 
 PlotLayout -> "Phase", 
 PlotLegends -> 
  Placed[LineLegend[{0.005, 0.1, 0.38, 1}, LegendLabel -> "\[Zeta]", 
    LegendFunction -> (Framed[#, RoundingRadius -> 5] &), 
    LegendMargins -> 3], {0.8, 0.7}]]

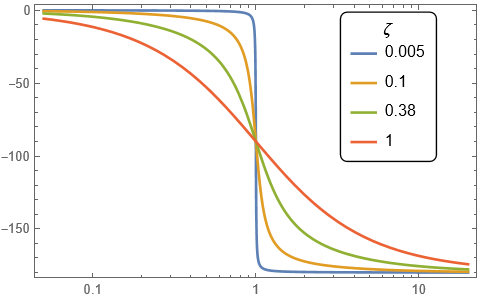
Which gives you a similar answer as given by @Nasser. You just need to change your units to the ones described in the reference.

bode-plot

Method 2: Using Direct formula from the theory of vibrations

You can easily find the theory of forced harmonic vibrations in any of the books on mechanical vibrations, like Theory of Vibration with Applications by William Thomson and Theory of Vibration, An Introduction by Ahmed A. Shabana, which directly provides you with the formula for phase angle ($\psi$) in terms of damping factor ($\zeta$) and frequency ratio ($r$) as:

$$ \psi = \tan^{-1} \bigg( \frac{2 r \zeta}{1-r^2} \bigg) $$

Then it's really easy to plot the phase-frequency curve:

\[Psi][\[Zeta]_, r_] := ArcTan[1 - r^2, 2  r  \[Zeta]];

Plot[Evaluate@
  Table[\[Psi][\[Zeta], r], {\[Zeta], {0.005, 0.1, 0.38, 1}}], {r, 0, 
  4}, PlotRange -> {{0, 3}, {0, 3.5}}, AspectRatio -> 1/GoldenRatio, 
 PlotPoints -> 1000, PlotTheme -> {"Scientific", "NeonColor"}, 
 FrameLabel -> {"Frequency ratio \[Rule]", "Phase angle \[Rule]"}, 
 LabelStyle -> {Black, Bold, 15}, 
 PlotLegends -> 
  Placed[SwatchLegend[Automatic, {0.005, 0.1, 0.38, 1}, 
    LegendMarkers -> "Bubble", LegendMarkerSize -> 20, 
    LegendFunction -> (Framed[#, RoundingRadius -> 10, 
        Background -> GrayLevel[0.85]] &), 
    LegendLabel -> "\[Zeta]"], {0.9, 0.25}], ImageSize -> Large]

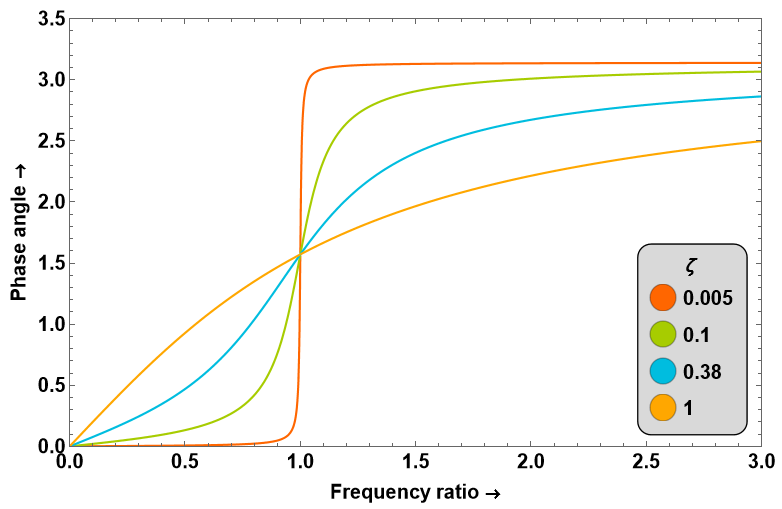
which gives you the desired plot:

phase-frequency

One more direct solution can be by making use of Mathematica's inbuilt BodePlot. You just need to find the Transfer function, which can be easily found in your equation by taking the Laplace Transform on both sides of the equation and is given as:

H[s_] := 1/(s^2 + 2 \[Zeta]  s + 1)

Now, use the BodePlot function, just for Phase by this code:

BodePlot[1/(s^2 + 2 (#)  s + 1) & /@ {0.005, 0.1, 0.38, 1}, 
 PlotLayout -> "Phase", 
 PlotLegends -> 
  Placed[LineLegend[{0.005, 0.1, 0.38, 1}, LegendLabel -> "\[Zeta]", 
    LegendFunction -> (Framed[#, RoundingRadius -> 5] &), 
    LegendMargins -> 3], {0.8, 0.7}]]

Which gives you a similar answer as given by @Nasser. You just need to change your units to the ones described in the reference.

bode-plot

Method 1 : Using Bode Plot from signals and systems

One more direct solution can be by making use of Mathematica's inbuilt BodePlot. You just need to find the Transfer function, which can be easily found in your equation by taking the Laplace Transform on both sides of the equation and is given as:

H[s_] := 1/(s^2 + 2 \[Zeta]  s + 1)

Now, use the BodePlot function, just for Phase by this code:

BodePlot[1/(s^2 + 2 (#)  s + 1) & /@ {0.005, 0.1, 0.38, 1}, 
 PlotLayout -> "Phase", 
 PlotLegends -> 
  Placed[LineLegend[{0.005, 0.1, 0.38, 1}, LegendLabel -> "\[Zeta]", 
    LegendFunction -> (Framed[#, RoundingRadius -> 5] &), 
    LegendMargins -> 3], {0.8, 0.7}]]

Which gives you a similar answer as given by @Nasser. You just need to change your units to the ones described in the reference.

bode-plot

Method 2: Using Direct formula from the theory of vibrations

You can easily find the theory of forced harmonic vibrations in any of the books on mechanical vibrations, like Theory of Vibration with Applications by William Thomson and Theory of Vibration, An Introduction by Ahmed A. Shabana, which directly provides you with the formula for phase angle ($\psi$) in terms of damping factor ($\zeta$) and frequency ratio ($r$) as:

$$ \psi = \tan^{-1} \bigg( \frac{2 r \zeta}{1-r^2} \bigg) $$

Then it's really easy to plot the phase-frequency curve:

\[Psi][\[Zeta]_, r_] := ArcTan[1 - r^2, 2  r  \[Zeta]];

Plot[Evaluate@
  Table[\[Psi][\[Zeta], r], {\[Zeta], {0.005, 0.1, 0.38, 1}}], {r, 0, 
  4}, PlotRange -> {{0, 3}, {0, 3.5}}, AspectRatio -> 1/GoldenRatio, 
 PlotPoints -> 1000, PlotTheme -> {"Scientific", "NeonColor"}, 
 FrameLabel -> {"Frequency ratio \[Rule]", "Phase angle \[Rule]"}, 
 LabelStyle -> {Black, Bold, 15}, 
 PlotLegends -> 
  Placed[SwatchLegend[Automatic, {0.005, 0.1, 0.38, 1}, 
    LegendMarkers -> "Bubble", LegendMarkerSize -> 20, 
    LegendFunction -> (Framed[#, RoundingRadius -> 10, 
        Background -> GrayLevel[0.85]] &), 
    LegendLabel -> "\[Zeta]"], {0.9, 0.25}], ImageSize -> Large]

which gives you the desired plot:
phase-frequency

Source Link
codebpr
  • 3k
  • 1
  • 8
  • 28

One more direct solution can be by making use of Mathematica's inbuilt BodePlot. You just need to find the Transfer function, which can be easily found in your equation by taking the Laplace Transform on both sides of the equation and is given as:

H[s_] := 1/(s^2 + 2 \[Zeta]  s + 1)

Now, use the BodePlot function, just for Phase by this code:

BodePlot[1/(s^2 + 2 (#)  s + 1) & /@ {0.005, 0.1, 0.38, 1}, 
 PlotLayout -> "Phase", 
 PlotLegends -> 
  Placed[LineLegend[{0.005, 0.1, 0.38, 1}, LegendLabel -> "\[Zeta]", 
    LegendFunction -> (Framed[#, RoundingRadius -> 5] &), 
    LegendMargins -> 3], {0.8, 0.7}]]

Which gives you a similar answer as given by @Nasser. You just need to change your units to the ones described in the reference.

bode-plot