Became Hot Network Question
deleted 47 characters in body; edited title
Source Link
Domen
  • 33.4k
  • 3
  • 47
  • 66

How toCan I Plot the Phase-Frequency Curve Using Mathematica?

I am trying to plot a phase angle vs. frequency curve numerically for the steady state condition of the following equation

x''[t] + 2*\[Zeta]*2 ζ x'[t] + x[t] == Cos[w*t]Cos[w t]

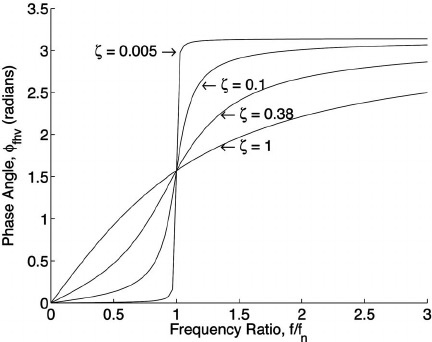
where w is the forcing frequency, and the initial conditions are x[0] == 0, x'[0] == 0. A similar plot is shown here. sample-plot:
Any help would be highly appreciated. Thankssample-plot

How to Plot the Phase-Frequency Curve Using Mathematica?

I am trying to plot a phase angle vs. frequency curve numerically for steady state condition of the following equation

x''[t] + 2*\[Zeta]* x'[t] + x[t] == Cos[w*t]

where w is the forcing frequency, and the initial conditions are x[0] == 0, x'[0] == 0. A similar plot is shown here. sample-plot

Any help would be highly appreciated. Thanks

How Can I Plot the Phase-Frequency Curve Using Mathematica?

I am trying to plot a phase angle vs. frequency curve numerically for the steady state condition of the following equation

x''[t] + 2 ζ x'[t] + x[t] == Cos[w t]

where w is the forcing frequency, and the initial conditions are x[0] == 0, x'[0] == 0. A similar plot is shown here:

sample-plot

edited title
Link
user64494
  • 29.1k
  • 4
  • 29
  • 56

How to plotPlot the Phase-Frequency curve usingCurve Using Mathematica?

made grammatical and structural changes
Source Link

How to plot the Phase vs. Frequency-Frequency curve using Mathematica?

I am trying to plot a phase angle vs. frequency curve numerically for steady state condition of the following equation

x''[t] + 2*\[Zeta]* x'[t] + x[t] == Cos[w*t]

where w is the forcing frequency, and the initial conditions are x[0] == 0, x'[0] == 0. A similar plot is shown here. enter image description heresample-plot

Any help would be highly appreciated. Thanks

Phase vs. Frequency curve

I am trying to plot a phase angle vs. frequency curve numerically for steady state condition of the following equation

x''[t] + 2*\[Zeta]* x'[t] + x[t] == Cos[w*t]

where w is the forcing frequency, and the initial conditions are x[0] == 0, x'[0] == 0. A similar plot is shown here. enter image description here

Any help would be highly appreciated. Thanks

How to plot the Phase-Frequency curve using Mathematica?

I am trying to plot a phase angle vs. frequency curve numerically for steady state condition of the following equation

x''[t] + 2*\[Zeta]* x'[t] + x[t] == Cos[w*t]

where w is the forcing frequency, and the initial conditions are x[0] == 0, x'[0] == 0. A similar plot is shown here. sample-plot

Any help would be highly appreciated. Thanks

Source Link
Loading