Edit
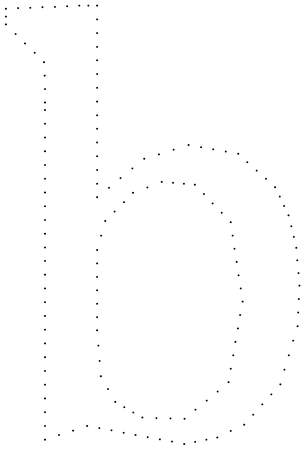
For the original code,we can subdivide the line to add some points.
polys = #["BoundaryPolygons"] &@
   BoundaryDiscretizeGraphics[
    Text[Style["b", FontFamily -> "Cambria"]], _Text,
    MaxCellMeasure -> {"Length" -> 1}];
δ = 1/4;
lines = MeshPrimitives[#, 1] & /@ polys;
Flatten[Map[
    Subdivide[Sequence @@ First@#, Ceiling[ArcLength@#/δ]] &,
    lines, {2}], 1] // Map@Point // Graphics
- We can use
ExportStringto extract the boundary curves from the fonts.( we can read https://reference.wolfram.com/language/ref/FilledCurve.html)
Clear[fonts, fillcurves];
fonts =
 ImportString[
  ExportString[Text[Style["qH", FontFamily -> "Cambria"]],
   "PDF"], {"PDF", "PageGraphics"}, "TextOutlines" -> True];
fillcurves = Cases[fonts, _FilledCurve, -1];
HighlightMesh[BoundaryDiscretizeGraphics[#, MaxCellMeasure -> .1],
    0] & /@ fillcurves // Show
- Similar with https://mathematica.stackexchange.com/a/289439/72111
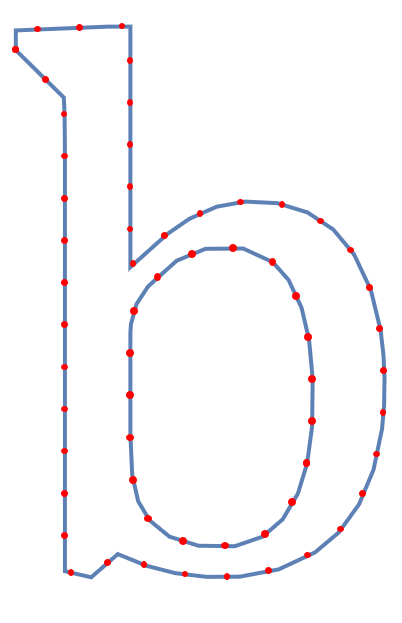
Clear["Global`*"];
lines = MeshPrimitives[
   BoundaryDiscretizeGraphics[
    ImportString[
      ExportString[Text[Style["b", FontFamily -> "Cambria"]],
       "PDF"], {"PDF", "PageGraphics"}, "TextOutlines" -> True][[1]],
    MaxCellMeasure -> .1], 1, "Multicells" -> True];
δ = .5;
MapThread[
  ListLinePlot[#1 /. Line -> Apply@Join,
    MeshFunctions -> {0 &, "ArcLength"}, Mesh -> {#2},
    MeshStyle -> Red, AspectRatio -> Automatic,
    Axes -> False] &, {lines,
   Subdivide /@ Floor /@ (ArcLength /@ lines/δ)}] // Show


