Became Hot Network Question
added 676 characters in body
Source Link

I am trying to fitThe code first produces a plot of the model to our flu outbreak datadataset, by findingthen simulates the SIR model using the parameter values $\beta$ and $\gamma$ that maximizewe found in the likelihoodmanual calibration to the full dataset of the total number infected .

(*Model*Set equations*parameter values*)
ClearAll[\[Beta]{\[Beta], \[Gamma]]\[Gamma]} = {1.7, 0.45};

(*Define the SIR model equations*)
sireqns = {s'[t] == -\[Beta]*s[t]*i[t]/n, 
   i'[t] == \[Beta]*s[t]*i[t]/n - \[Gamma]*i[t], 
   r'[t] == \[Gamma]*i[t]};
(*Initial conditions*)
initialConditions = {s[0] == n-1, i[0] == 1, r[0] == 0};

(* Solving*Solve the differential equations *equations*)
sol = ParametricNDSolve[NDSolve[{sireqns, initialConditions}, {s, i, r}, {t, 
    0, tmax}, {\[Beta], \[Gamma]}];

predicted(*Extract the infected values from the solution*)
infectedValues = i /. sol;
sol[[1]];
(*LikelihoodfitPlot function*)= 
likelihood[\[Beta]_?NumericQ Plot[infectedValues[t], \[Gamma]_?NumericQ]{t, :=1, 14}, PlotStyle -> Red, 
  Exp[Total[(numberinfectedPlotStyle -> predicted)^2]];


(*MaximizeRed, thePlotRange likelihood*)
result-> =All, 
  NMaximize[PlotLegends -> {Log[likelihood[\[Beta]"Simulated infected"}];
Show[pointsPlot, \[Gamma]]]fitPlot, 0PlotRange <=-> \[Beta]All]

enter image description here

Now, we want to calculate the likelihood of the model with these specific parameter values, i . e . the probability of observing these numbers of reported cases given our simulated numbers of infected people .

We are building up to calibrating the SIR model to our flu outbreak data from previous exercises using likelihood as a measure of the divergence between the model projections and the data. This time, even though we are looking at the same outbreak, the dataset only shows the reported cases, and we know that 60 % of flu cases are reported.

(*Adjust <=infected 2,values for reporting rate*)adjustedInfectedValues = 
 infectedValues*0.6

(*Simulated reported cases*)
simulatedReportedCases = 0Round[adjustedInfectedValues]

(*Likelihood <=calculation*)
likelihood \[Gamma]= <= 
 1} Product[Exp[-\[Lambda]] \[Lambda]^k/k!, {\[Beta]\[Lambda], \[Gamma]
    simulatedReportedCases}];

optimalParameters =(*Print {\[Beta],the \[Gamma]}likelihood /.value*)
Print["Likelihood:", Last[result]likelihood]

I am looking for this solution enter image description here
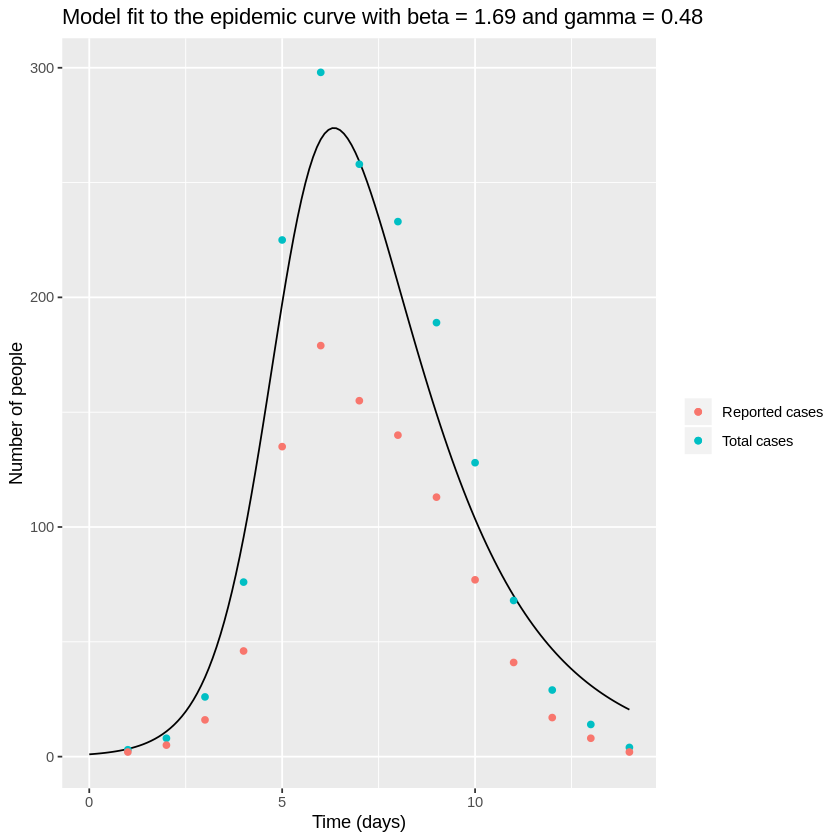
I tried to write some code similar to Writing a sum-of-squares function or SIR model fits but towards the end, I can't find my error. Any suggestions?enter image description here

I am trying to fit the model to our flu outbreak data, by finding the parameter values $\beta$ and $\gamma$ that maximize the likelihood.

(*Model equations*)
ClearAll[\[Beta], \[Gamma]]
sireqns = {s'[t] == -\[Beta]*s[t]*i[t]/n, 
   i'[t] == \[Beta]*s[t]*i[t]/n - \[Gamma]*i[t], 
   r'[t] == \[Gamma]*i[t]};
(*Initial conditions*)
initialConditions = {s[0] == n-1, i[0] == 1, r[0] == 0};

(* Solving the differential equations *)
sol = ParametricNDSolve[{sireqns, initialConditions}, {s, i, r}, {t, 
    0, tmax}, {\[Beta], \[Gamma]}];

predicted = i /. sol;

(*Likelihood function*)
likelihood[\[Beta]_?NumericQ, \[Gamma]_?NumericQ] := 
  Exp[Total[(numberinfected - predicted)^2]];


(*Maximize the likelihood*)
result = 
  NMaximize[{Log[likelihood[\[Beta], \[Gamma]]], 0 <= \[Beta] <= 2, 
    0 <= \[Gamma] <= 1}, {\[Beta], \[Gamma]}];

optimalParameters = {\[Beta], \[Gamma]} /. Last[result]

I am looking for this solution enter image description here

I tried to write some code similar to Writing a sum-of-squares function or SIR model fits but towards the end, I can't find my error. Any suggestions?

The code first produces a plot of the dataset, then simulates the SIR model using the parameter values we found in the manual calibration to the full dataset of the total number infected .

*Set parameter values*)
{\[Beta], \[Gamma]} = {1.7, 0.45};

(*Define the SIR model equations*)
sireqns = {s'[t] == -\[Beta]*s[t]*i[t]/n, 
   i'[t] == \[Beta]*s[t]*i[t]/n - \[Gamma]*i[t], 
   r'[t] == \[Gamma]*i[t]};

initialConditions = {s[0] == n, i[0] == 1, r[0] == 0};

(*Solve the differential equations*)
sol = NDSolve[{sireqns, initialConditions}, {s, i, r}, {t, 0, tmax}];

(*Extract the infected values from the solution*)
infectedValues = i /. sol[[1]];
fitPlot = 
 Plot[infectedValues[t], {t, 1, 14}, PlotStyle -> Red, 
  PlotStyle -> Red, PlotRange -> All, 
  PlotLegends -> {"Simulated infected"}];
Show[pointsPlot, fitPlot, PlotRange -> All]

enter image description here

Now, we want to calculate the likelihood of the model with these specific parameter values, i . e . the probability of observing these numbers of reported cases given our simulated numbers of infected people .

We are building up to calibrating the SIR model to our flu outbreak data from previous exercises using likelihood as a measure of the divergence between the model projections and the data. This time, even though we are looking at the same outbreak, the dataset only shows the reported cases, and we know that 60 % of flu cases are reported.

(*Adjust infected values for reporting rate*)adjustedInfectedValues = 
 infectedValues*0.6

(*Simulated reported cases*)
simulatedReportedCases = Round[adjustedInfectedValues]

(*Likelihood calculation*)
likelihood =  
  Product[Exp[-\[Lambda]] \[Lambda]^k/k!, {\[Lambda], 
    simulatedReportedCases}];

(*Print the likelihood value*)
Print["Likelihood:", likelihood]

enter image description here

edited body
Source Link
edited body
Source Link

I am trying to fit the model to our flu outbreak data, by finding the parameter values $\beta$ and $\gamma$ that maximize the likelihood.

(*total size of population*) n = 763;

(*days*)
tmax = 14;

(*Flu dataset*)
numberinfected = {3, 8, 26, 76, 225, 298, 258, 233, 189, 128, 68, 29, 
   14, 4};

pointsPlot = 
 ListPlot[numberinfected, PlotStyle -> Purple, 
  PlotTheme -> "Detailed", 
  FrameLabel -> {"Time (days)", "Number Infected"}, 
  PlotLegends -> {"Total cases"}]

enter image description here

(*Model equations*)
ClearAll[\[Beta], \[Gamma]]
sireqns = {s'[t] == -\[Beta]*s[t]*i[t]/n, 
   i'[t] == \[Beta]*s[t]*i[t]/n - \[Gamma]*i[t], 
   r'[t] == \[Gamma]*i[t]};
(*Initial conditions*)
initialConditions = {s[0] == n-1, i[0] == 1, r[0] == 0};

(* Solving the differential equations *)
sol = ParametricNDSolve[{sireqns, initialConditions}, {s, i, r}, {t, 
    0, tmax}, {\[Beta], \[Gamma]}];

predicted = i /. sol;

(*Likelihood function*)
likelihood[\[Beta]_?NumericQ, \[Gamma]_?NumericQ] := 
  Exp[Total[(numberinfected - predicted)^2]];


(*Maximize the likelihood*)
result = 
  NMaximize[{Log[likelihood[\[Beta], \[Gamma]]], 0 <= \[Beta] <= 12, 
    0 <= \[Gamma] <= 1}, {\[Beta], \[Gamma]}];

optimalParameters = {\[Beta], \[Gamma]} /. Last[result]

I am looking for this solution enter image description here

I tried to write some code similar to Writing a sum-of-squares function or SIR model fits but towards the end, I can't find my error. Any suggestions?

I am trying to fit the model to our flu outbreak data, by finding the parameter values $\beta$ and $\gamma$ that maximize the likelihood.

(*total size of population*) n = 763;

(*days*)
tmax = 14;

(*Flu dataset*)
numberinfected = {3, 8, 26, 76, 225, 298, 258, 233, 189, 128, 68, 29, 
   14, 4};

pointsPlot = 
 ListPlot[numberinfected, PlotStyle -> Purple, 
  PlotTheme -> "Detailed", 
  FrameLabel -> {"Time (days)", "Number Infected"}, 
  PlotLegends -> {"Total cases"}]

enter image description here

(*Model equations*)
ClearAll[\[Beta], \[Gamma]]
sireqns = {s'[t] == -\[Beta]*s[t]*i[t]/n, 
   i'[t] == \[Beta]*s[t]*i[t]/n - \[Gamma]*i[t], 
   r'[t] == \[Gamma]*i[t]};
(*Initial conditions*)
initialConditions = {s[0] == n-1, i[0] == 1, r[0] == 0};

(* Solving the differential equations *)
sol = ParametricNDSolve[{sireqns, initialConditions}, {s, i, r}, {t, 
    0, tmax}, {\[Beta], \[Gamma]}];

predicted = i /. sol;

(*Likelihood function*)
likelihood[\[Beta]_?NumericQ, \[Gamma]_?NumericQ] := 
  Exp[Total[(numberinfected - predicted)^2]];


(*Maximize the likelihood*)
result = 
  NMaximize[{Log[likelihood[\[Beta], \[Gamma]]], 0 <= \[Beta] <= 1, 
    0 <= \[Gamma] <= 1}, {\[Beta], \[Gamma]}];

optimalParameters = {\[Beta], \[Gamma]} /. Last[result]

I am looking for this solution enter image description here

I tried to write some code similar to Writing a sum-of-squares function or SIR model fits but towards the end, I can't find my error. Any suggestions?

I am trying to fit the model to our flu outbreak data, by finding the parameter values $\beta$ and $\gamma$ that maximize the likelihood.

(*total size of population*) n = 763;

(*days*)
tmax = 14;

(*Flu dataset*)
numberinfected = {3, 8, 26, 76, 225, 298, 258, 233, 189, 128, 68, 29, 
   14, 4};

pointsPlot = 
 ListPlot[numberinfected, PlotStyle -> Purple, 
  PlotTheme -> "Detailed", 
  FrameLabel -> {"Time (days)", "Number Infected"}, 
  PlotLegends -> {"Total cases"}]

enter image description here

(*Model equations*)
ClearAll[\[Beta], \[Gamma]]
sireqns = {s'[t] == -\[Beta]*s[t]*i[t]/n, 
   i'[t] == \[Beta]*s[t]*i[t]/n - \[Gamma]*i[t], 
   r'[t] == \[Gamma]*i[t]};
(*Initial conditions*)
initialConditions = {s[0] == n-1, i[0] == 1, r[0] == 0};

(* Solving the differential equations *)
sol = ParametricNDSolve[{sireqns, initialConditions}, {s, i, r}, {t, 
    0, tmax}, {\[Beta], \[Gamma]}];

predicted = i /. sol;

(*Likelihood function*)
likelihood[\[Beta]_?NumericQ, \[Gamma]_?NumericQ] := 
  Exp[Total[(numberinfected - predicted)^2]];


(*Maximize the likelihood*)
result = 
  NMaximize[{Log[likelihood[\[Beta], \[Gamma]]], 0 <= \[Beta] <= 2, 
    0 <= \[Gamma] <= 1}, {\[Beta], \[Gamma]}];

optimalParameters = {\[Beta], \[Gamma]} /. Last[result]

I am looking for this solution enter image description here

I tried to write some code similar to Writing a sum-of-squares function or SIR model fits but towards the end, I can't find my error. Any suggestions?

Source Link
Loading