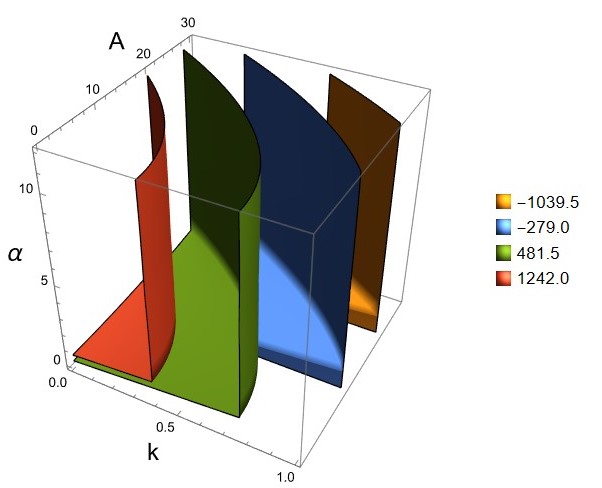
An alternative method using ListContourPlot3D:
expr = 2 Zeta[1 + α] - PolyLog[1 + α, Exp[I*k]] - PolyLog[1 + α, Exp[-I*k]] - 2 A^2;

ListContourPlot3D[Table[expr, {k, -2 π, 2 π}, {A, 0, 30}, {α, 0.001, 2}],
Contours -> 4, Mesh -> None, AxesLabel -> {Style["k", Black, 18],
Style["A", Black, 18], Style["α", Black, 18]}, PlotLegends -> Automatic]
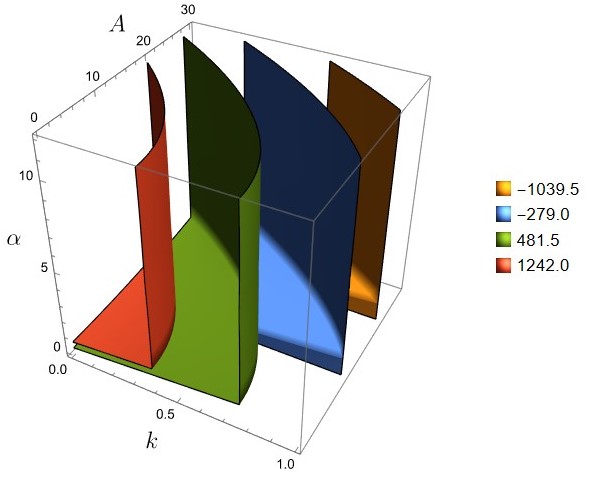
Or using MaTeX:
<< MaTeX`
ListContourPlot3D[Table[expr, {k, -2 π, 2 π}, {A, 0, 30}, {α, 0.001, 2}],
Contours -> 4, Mesh -> None, AxesLabel -> {MaTeX["k", Magnification -> 1.5],
MaTeX["A", Magnification -> 1.5], MaTeX["\\alpha", Magnification -> 1.5]},
PlotLegends -> Automatic]
Evaluate ResourceFunction["MaTeXInstall"][] to install or upgrade MaTeX.


