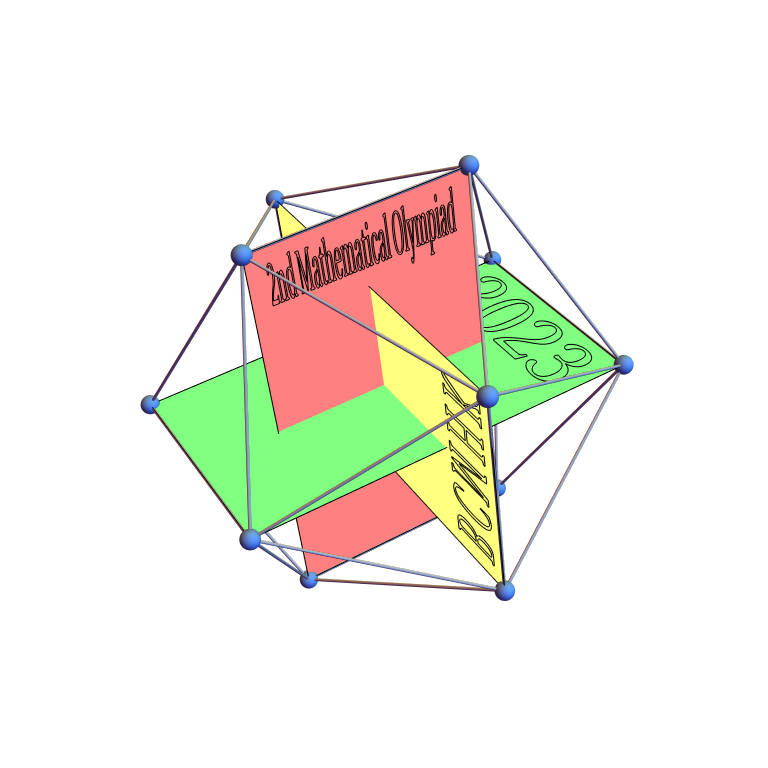
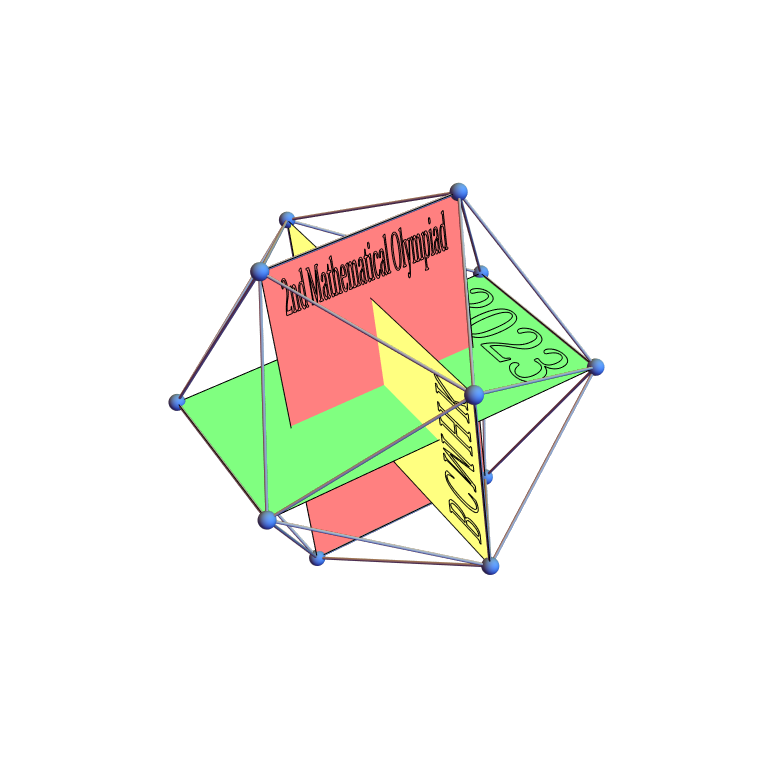
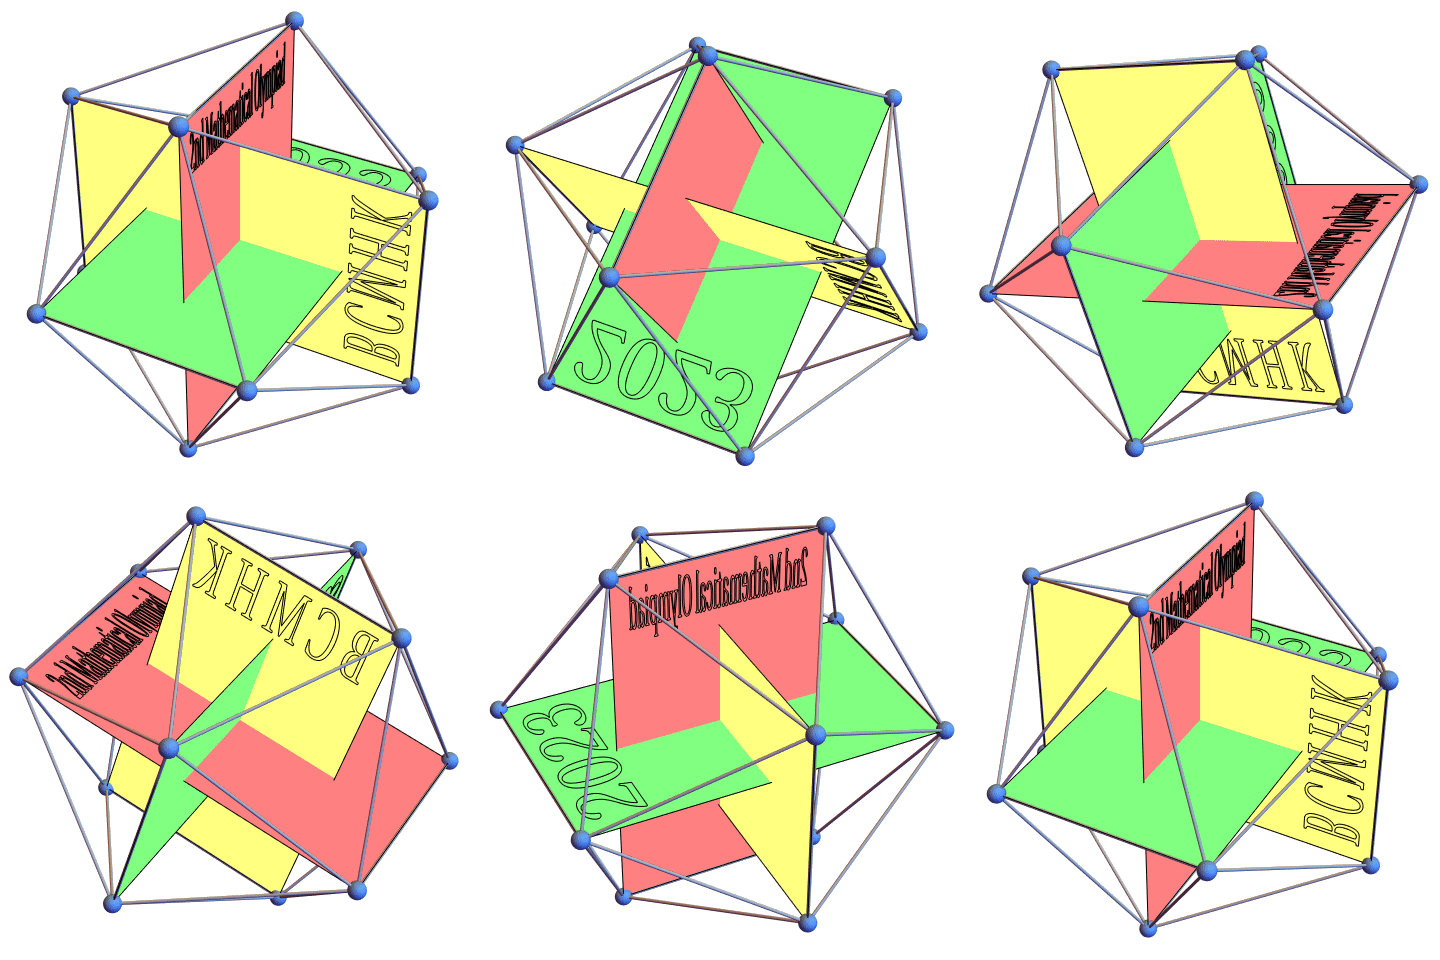
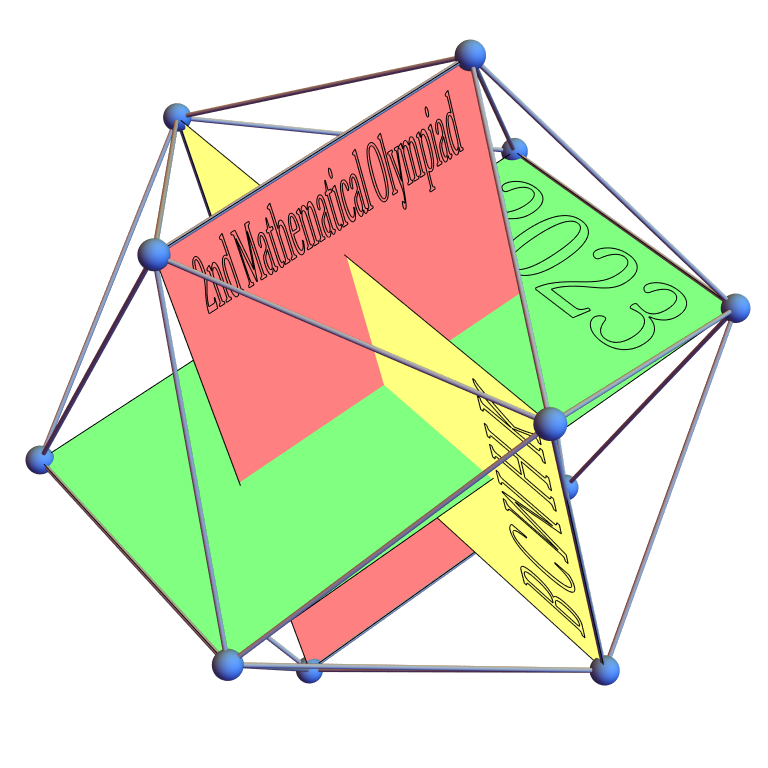
Using the approach from this answer to construct the polygons and lines:
cp = Map[Prepend[0]]@Delete[{{3}, {6}}]@CirclePoints[{1, Pi/3}, 6];

coords = Table[Map[RotateRight[#, i - 1] &]@cp, {i, 3}];

colors = {RGBColor[1, .5, .5], RGBColor[1, 1, .5], RGBColor[.5, 1, .5]};
Transform text primitives to 3D coordinates by processing the output from BoundaryDiscretizeGraphics:
ClearAll[textCoords]
textCoords[string_, cbounds_ : {{-1/2, 1/2}, {1/2, 5/6}}, padding_ : .2] :=
  Module[{tc = (MeshPrimitives[
         BoundaryDiscretizeGraphics[Text[string], _Text], 1,
         Multicells -> True] /. Line[x_] :> Line[Join @@ x])[[All, 1]]},
    Map[Map[Prepend[0] @*
     RescalingTransform[(1 + padding) CoordinateBounds @ tc, cbounds]]] @ tc];

labels = {"2nd Mathematical Olympiad", "B C M H K", "2023"};

textcoordinates = MapIndexed[{x, y} |->
   Map[Map[RotateRight[#, -1 + First @ y] &]][
      textCoords[Style[x, FontFamily -> "Times"]]]] @ labels;

show = Show[Graphics3D @
   Thread[{AbsoluteThickness[1/2], Black, Map[Line] @ textcoordinates,
     colors, Lighting -> {{"Ambient", White}}, Polygon /@ coords}],
  MeshConnectivityGraph @ ConvexHullRegion[Join @@ coords],
  SphericalRegion -> True, Boxed -> False,
  PlotRange -> .91, ImageSize -> Large]Large, ImagePadding -> 5]
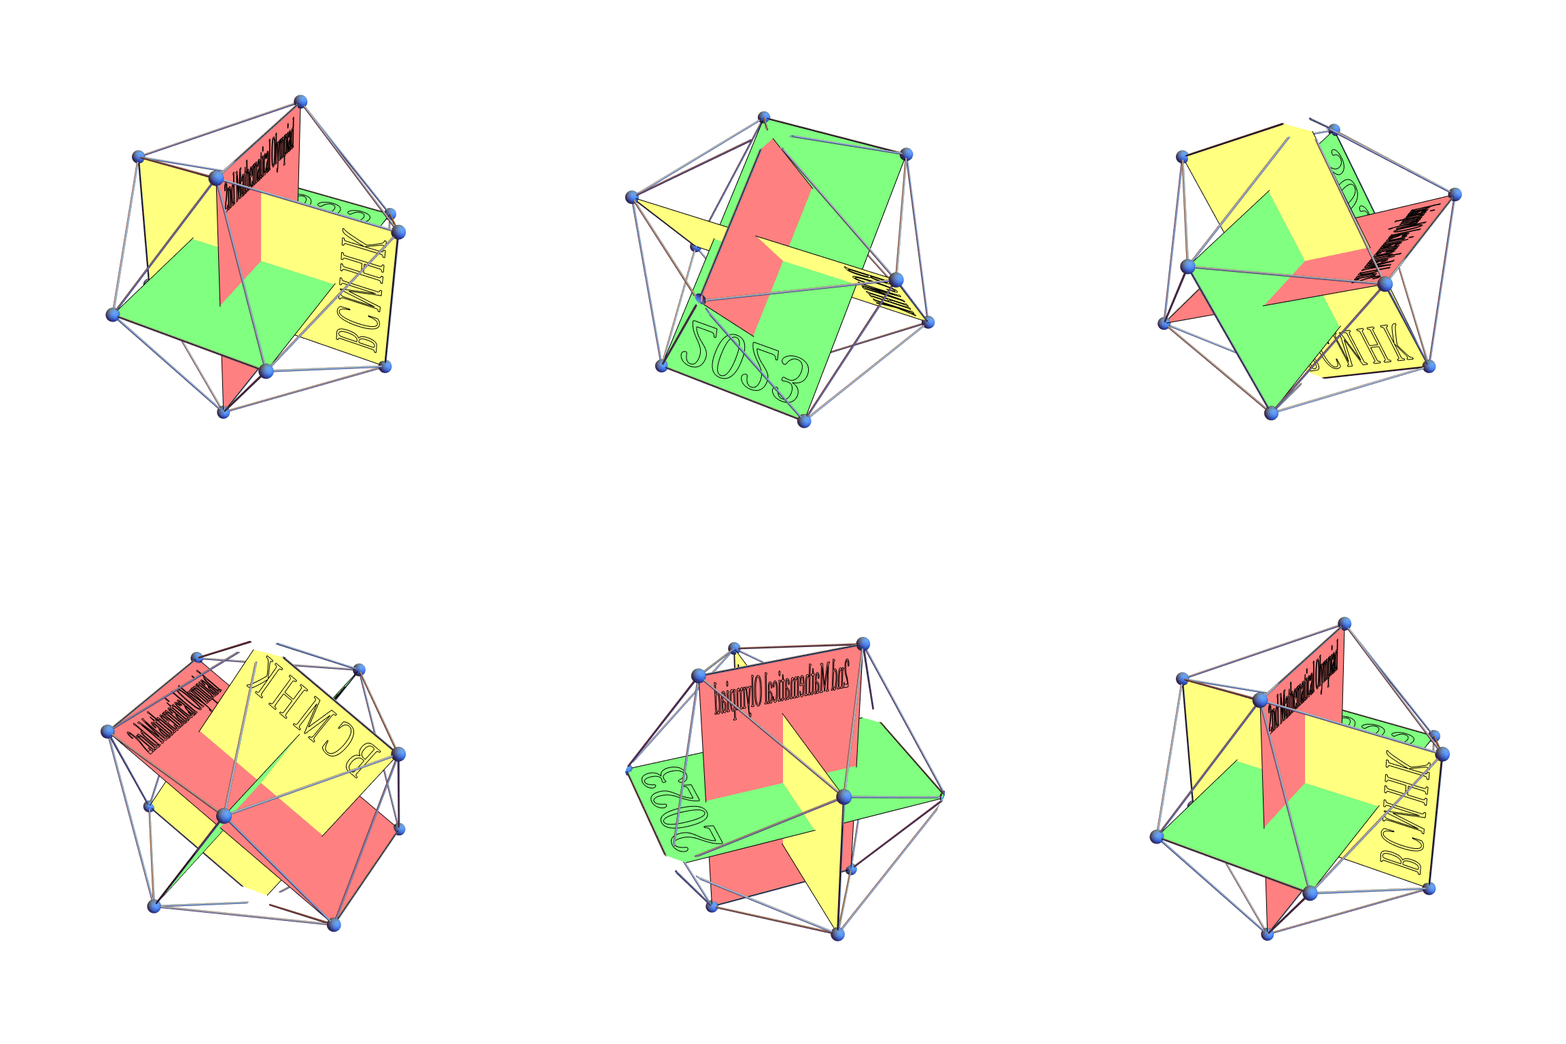
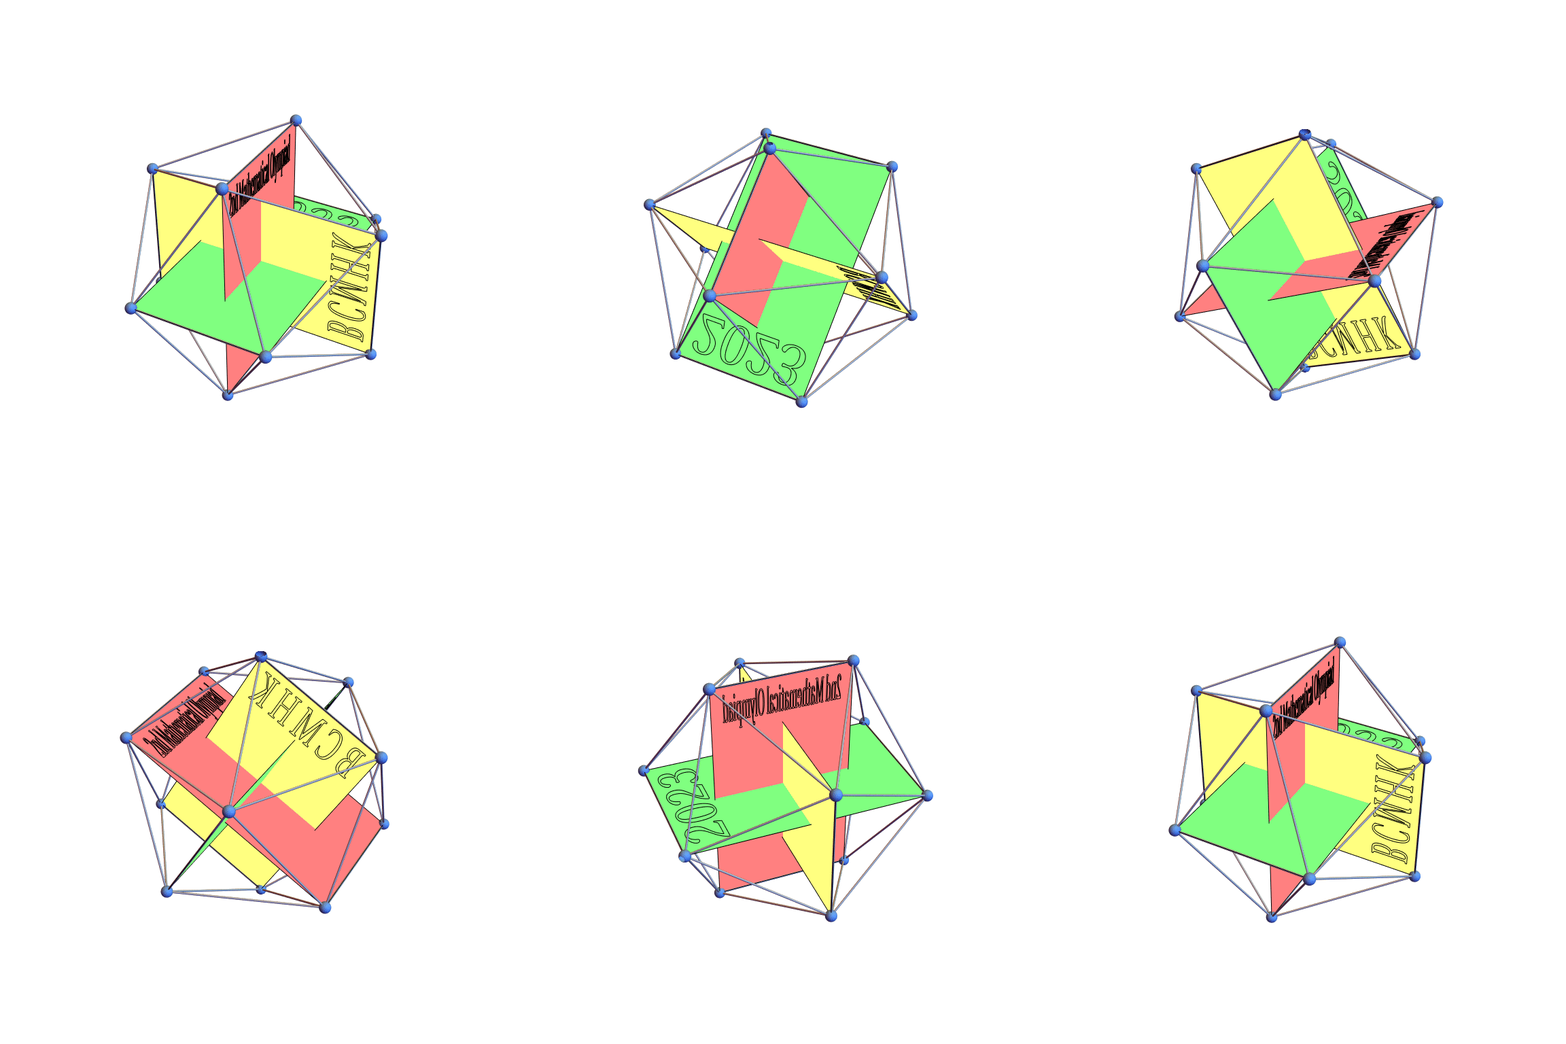
Animation above produced using
rotate[angle_, axis_] := MapAt[Rotate[#, angle, UnitVector[3, axis]] &, {1}]

frames = Join @@ Table[rotate[2 Pi t, a]@show, {a, 1, 3, 1}, {t, 0, 1, 1/18}];

Export["MathOlympiad.gif", frames]
Notes:
$Version
"13.3.0 for Linux x86 (64-bit) (June 3, 2023)"
Ignore the red syntax highlighting of Multicells -> True.

