@PatoCriollo, @chuy, when I added the 3rd parameter $m$ as @PatoCriollo suggested, it doesn't seem to work as well. I've provided the data above maybe you may want to play around with it. The plot of the data point itself [Fig 1.] is smooth so I'm not sure what's going on. Thanks
Source Link
Afloz
  • 261
  • 2
  • 8

Data

{2.598410^-56,1.226610^-25,2.7740210^-19,1.1418210^-15,3.4364710^-13,2.4631310^-11,7.1391710^-10,1.1104510^-8,1.0975410^-7,7.6858910^-7,4.10723*10^-6,0.0000176576,0.0000634956,0.000196694,0.000537035,0.00131592,0.00293618,0.00603686,0.0115497,0.0207306,0.035151,0.0566368,0.0871538,0.128646,0.18284,0.25105,0.333986,0.43162,0.543096,0.666724,0.800034,0.939904,1.08273,1.22464,1.36169,1.49013,1.60652,1.70795,1.79211,1.85739,1.90287,1.92831,1.93411,1.92122,1.89103,1.84532,1.78606,1.71543,1.6356,1.54874,1.45694,1.36212,1.26602,1.17018,1.07592,0.984329,0.896293,0.812488,0.733406,0.659374,0.590571,0.527055,0.468779,0.415615,0.36737,0.323804,0.284642,0.249587,0.218334,0.190572,0.165997,0.144312,0.125236,0.1085,0.0938559,0.0810734,0.0699408,0.0602653,0.0518725,0.0446053,0.038323,0.0329003,0.0282261,0.0242021,0.0207417,0.0177691,0.0152178,0.0130299,0.0111549,0.0095491,0.00817446,0.00699822,0.00599209,0.00513167,0.00439598,0.003767,0.00322925,0.00276948,0.00237632,0.00204006}

I'm having a little problem with the NonLinearModelFit function. I'm hoping someone can point me in the right direction please. I have this data points: https://www.dropbox.com/s/5hflg2nvko26hpz/question.nb

When I plot the data points I have this:
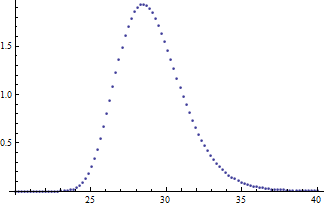
datapoints

Then I use a Rice (Rician) Distribution Curve as model for fitting. For this, I used $$\frac{x \exp \left(-\frac{v^2+x^2}{2 \sigma ^2}\right) I_0\left(\frac{x v}{\sigma ^2}\right)}{\sigma ^2}$$

But when I plot both curves together I get something like this figure where the fit is the very tiny one below: enter image description here
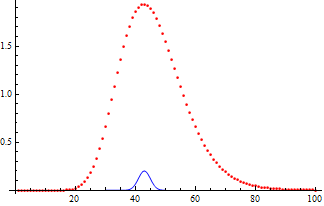
I checked the Residual fit and I got something really disturbing. Showing that my fit has a large error margin:
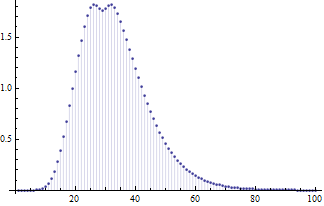
enter image description here

Honestly, I'm not sure what's wrong. I've spent some time on this and I think I need an outside eye to help look at it. Any idea will be much appreciated. Thanks friends.

I'm having a little problem with the NonLinearModelFit function. I'm hoping someone can point me in the right direction please. I have this data points: https://www.dropbox.com/s/5hflg2nvko26hpz/question.nb

When I plot the data points I have this:

datapoints

Then I use a Rice (Rician) Distribution Curve as model for fitting.

But when I plot both curves together I get something like this figure where the fit is the very tiny one below: enter image description here

I checked the Residual fit and I got something really disturbing. Showing that my fit has a large error margin:

enter image description here

Honestly, I'm not sure what's wrong. I've spent some time on this and I think I need an outside eye to help look at it. Any idea will be much appreciated. Thanks friends.

Data

{2.598410^-56,1.226610^-25,2.7740210^-19,1.1418210^-15,3.4364710^-13,2.4631310^-11,7.1391710^-10,1.1104510^-8,1.0975410^-7,7.6858910^-7,4.10723*10^-6,0.0000176576,0.0000634956,0.000196694,0.000537035,0.00131592,0.00293618,0.00603686,0.0115497,0.0207306,0.035151,0.0566368,0.0871538,0.128646,0.18284,0.25105,0.333986,0.43162,0.543096,0.666724,0.800034,0.939904,1.08273,1.22464,1.36169,1.49013,1.60652,1.70795,1.79211,1.85739,1.90287,1.92831,1.93411,1.92122,1.89103,1.84532,1.78606,1.71543,1.6356,1.54874,1.45694,1.36212,1.26602,1.17018,1.07592,0.984329,0.896293,0.812488,0.733406,0.659374,0.590571,0.527055,0.468779,0.415615,0.36737,0.323804,0.284642,0.249587,0.218334,0.190572,0.165997,0.144312,0.125236,0.1085,0.0938559,0.0810734,0.0699408,0.0602653,0.0518725,0.0446053,0.038323,0.0329003,0.0282261,0.0242021,0.0207417,0.0177691,0.0152178,0.0130299,0.0111549,0.0095491,0.00817446,0.00699822,0.00599209,0.00513167,0.00439598,0.003767,0.00322925,0.00276948,0.00237632,0.00204006}

I'm having a little problem with the NonLinearModelFit function. I'm hoping someone can point me in the right direction please. I have this data points: https://www.dropbox.com/s/5hflg2nvko26hpz/question.nb

When I plot the data points I have this:

datapoints

Then I use a Rice (Rician) Distribution Curve as model for fitting. For this, I used $$\frac{x \exp \left(-\frac{v^2+x^2}{2 \sigma ^2}\right) I_0\left(\frac{x v}{\sigma ^2}\right)}{\sigma ^2}$$

But when I plot both curves together I get something like this figure where the fit is the very tiny one below: enter image description here

I checked the Residual fit and I got something really disturbing. Showing that my fit has a large error margin:

enter image description here

Honestly, I'm not sure what's wrong. I've spent some time on this and I think I need an outside eye to help look at it. Any idea will be much appreciated. Thanks friends.

Source Link
Afloz
  • 261
  • 2
  • 8

Why Do I Have Large Error Margin Using NonLinearModelFit function

I'm having a little problem with the NonLinearModelFit function. I'm hoping someone can point me in the right direction please. I have this data points: https://www.dropbox.com/s/5hflg2nvko26hpz/question.nb

When I plot the data points I have this:

datapoints

Then I use a Rice (Rician) Distribution Curve as model for fitting.

But when I plot both curves together I get something like this figure where the fit is the very tiny one below: enter image description here

I checked the Residual fit and I got something really disturbing. Showing that my fit has a large error margin:

enter image description here

Honestly, I'm not sure what's wrong. I've spent some time on this and I think I need an outside eye to help look at it. Any idea will be much appreciated. Thanks friends.