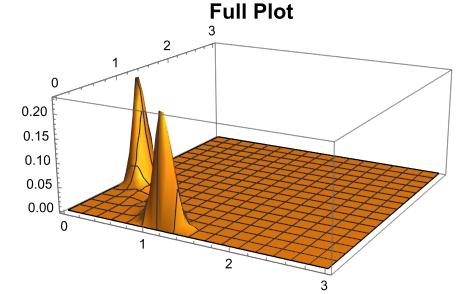
added 3374 characters in body
Source Link
josh
  • 2.5k
  • 5
  • 18

EditedEdit2: Added code to back-substitute numerical solution into DE

Edit1: Changed after studying solution

enter image description here

Back-substitution of solution into DE:

 (* compute solution with cell measure=0.0005 *)

 cellMeasure = 0.0005;
delt[x_, y_] := 
  PDF[MultinormalDistribution[{0, 0}, {{1/2, 0}, {0, 1/2}}], {x, 
    y}]; 
b = 1; k = 1; n = 4; S = 1/2; a = 2/10;
FPE = \!\(
\*SubscriptBox[\(\[PartialD]\), \(t\)]\(p[x, y, t]\)\) == s*\!\(
\*SubscriptBox[\(\[PartialD]\), \(x, x\)]\(p[x, y, t]\)\) + s*\!\(
\*SubscriptBox[\(\[PartialD]\), \(y, y\)]\(p[x, y, t]\)\) - \!\(
\*SubscriptBox[\(\[PartialD]\), \(x\)]\((\((\((a*x^n)\)/\((S^n + 
            x^n)\) + \((b*S^n)\)/\((S^n + y^n)\) - k*x)\)*
       p[x, y, t])\)\) - \!\(
\*SubscriptBox[\(\[PartialD]\), \(y\)]\((\((\((\((a*y^n)\)/\((S^n + 
             y^n)\) + \((b*S^n)\)/\((S^n + x^n)\) - k*y)\))\)*
       p[x, y, t])\)\);
s = 1/100;
sol = NDSolveValue[ {FPE, p[x, y, 0] == delt[x, y],
    p[3, y, t] == 0,
    p[0, y, t] == 0,
    p[x, 0, t] == 0,
    p[x, 3, t] == 0
    }, p, {t, 0, 10}, {y, 0, 3}, {x, 0, 3}, 
   Method -> {"MethodOfLines", "TemporalVariable" -> t, 
      "SpatialDiscretization" -> {"FiniteElement", 
       "MeshOptions" -> MaxCellMeasure -> cellMeasure}}];

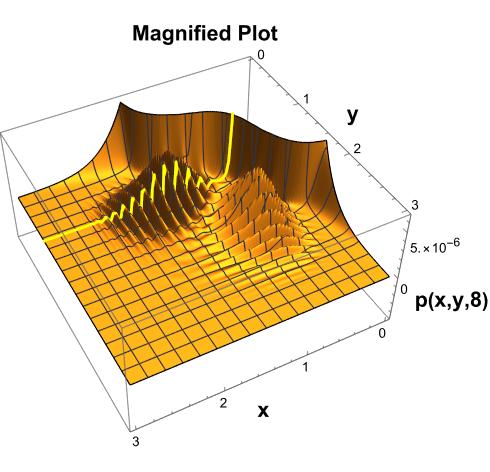
Now plot p(x,y,t) and a yellow trace of p(x,0.8,8) just for visualization:

(* Plot magnified solution and a yellow trace of the solution \
p(x,0.8,8) *)  

trace1 = 
  ParametricPlot3D[{x, 0.8, sol[x, 0.8, 8]}, {x, 0, 3}, 
   PlotStyle -> Yellow, PlotRange -> All];
 magPlot = 
  Plot3D[sol[x, y, 8], {x, 0, 3}, {y, 0, 3}, PlotPoints -> 250, 
   BoxRatios -> {1, 1, 0.5}, 
   PlotLabel -> Style["Magnified Plot", 16, Bold, Black], 
   AxesLabel -> {Style["x", 16, Bold, Black], 
     Style["y", 16, Bold, Black], Style["p(x,y,8)", 16, Bold, Black]},
    ClippingStyle -> None];
Show[{magPlot, trace1}]

enter image description here

Now compare the left side of the DE with the right side of the DE at the point (1.2,0.8,8) along the yellow trace (or any other point (x,y,8) and print the values:

tVal = 8;
yVal = .8;
xVal = 1.2;
leftSide = (\!\(
\*SubscriptBox[\(\[PartialD]\), \(t\)]\(p[x, y, t]\)\) //. {p -> sol, 
     x -> xVal, y -> yVal, t -> tVal});
rightSide = (s*\!\(
\*SubscriptBox[\(\[PartialD]\), \(x, x\)]\(p[x, y, t]\)\) + s*\!\(
\*SubscriptBox[\(\[PartialD]\), \(y, y\)]\(p[x, y, t]\)\) - \!\(
\*SubscriptBox[\(\[PartialD]\), \(x\)]\((\((\((a*x^n)\)/\((S^n + 
             x^n)\) + \((b*S^n)\)/\((S^n + y^n)\) - k*x)\)*
        p[x, y, t])\)\) - \!\(
\*SubscriptBox[\(\[PartialD]\), \(y\)]\((\((\((\((a*y^n)\)/\((S^n + 
              y^n)\) + \((b*S^n)\)/\((S^n + x^n)\) - k*y)\))\)*
        p[x, y, t])\)\)) //. {p -> sol, x -> xVal, y -> yVal, 
    t -> tVal};

Print["Left side: ", leftSide];
Print["Right side: ", rightSide];

(* Left side: -3.92564*10^-7 *)

(* Right side: 0.0000816017 *)

The difference is not small. I'm not proficient with PDEs and now sure why. You should be able to study this code and test it at other points.

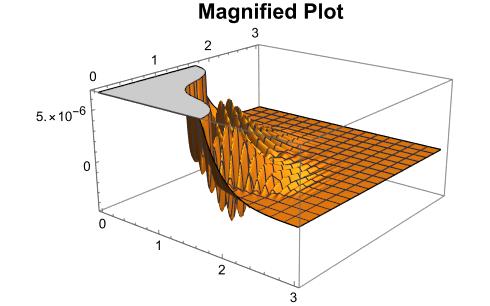
Edited: Changed after studying solution

enter image description here

Edit2: Added code to back-substitute numerical solution into DE

Edit1: Changed after studying solution

enter image description here

Back-substitution of solution into DE:

 (* compute solution with cell measure=0.0005 *)

 cellMeasure = 0.0005;
delt[x_, y_] := 
  PDF[MultinormalDistribution[{0, 0}, {{1/2, 0}, {0, 1/2}}], {x, 
    y}]; 
b = 1; k = 1; n = 4; S = 1/2; a = 2/10;
FPE = \!\(
\*SubscriptBox[\(\[PartialD]\), \(t\)]\(p[x, y, t]\)\) == s*\!\(
\*SubscriptBox[\(\[PartialD]\), \(x, x\)]\(p[x, y, t]\)\) + s*\!\(
\*SubscriptBox[\(\[PartialD]\), \(y, y\)]\(p[x, y, t]\)\) - \!\(
\*SubscriptBox[\(\[PartialD]\), \(x\)]\((\((\((a*x^n)\)/\((S^n + 
            x^n)\) + \((b*S^n)\)/\((S^n + y^n)\) - k*x)\)*
       p[x, y, t])\)\) - \!\(
\*SubscriptBox[\(\[PartialD]\), \(y\)]\((\((\((\((a*y^n)\)/\((S^n + 
             y^n)\) + \((b*S^n)\)/\((S^n + x^n)\) - k*y)\))\)*
       p[x, y, t])\)\);
s = 1/100;
sol = NDSolveValue[ {FPE, p[x, y, 0] == delt[x, y],
    p[3, y, t] == 0,
    p[0, y, t] == 0,
    p[x, 0, t] == 0,
    p[x, 3, t] == 0
    }, p, {t, 0, 10}, {y, 0, 3}, {x, 0, 3}, 
   Method -> {"MethodOfLines", "TemporalVariable" -> t, 
      "SpatialDiscretization" -> {"FiniteElement", 
       "MeshOptions" -> MaxCellMeasure -> cellMeasure}}];

Now plot p(x,y,t) and a yellow trace of p(x,0.8,8) just for visualization:

(* Plot magnified solution and a yellow trace of the solution \
p(x,0.8,8) *)  

trace1 = 
  ParametricPlot3D[{x, 0.8, sol[x, 0.8, 8]}, {x, 0, 3}, 
   PlotStyle -> Yellow, PlotRange -> All];
 magPlot = 
  Plot3D[sol[x, y, 8], {x, 0, 3}, {y, 0, 3}, PlotPoints -> 250, 
   BoxRatios -> {1, 1, 0.5}, 
   PlotLabel -> Style["Magnified Plot", 16, Bold, Black], 
   AxesLabel -> {Style["x", 16, Bold, Black], 
     Style["y", 16, Bold, Black], Style["p(x,y,8)", 16, Bold, Black]},
    ClippingStyle -> None];
Show[{magPlot, trace1}]

enter image description here

Now compare the left side of the DE with the right side of the DE at the point (1.2,0.8,8) along the yellow trace (or any other point (x,y,8) and print the values:

tVal = 8;
yVal = .8;
xVal = 1.2;
leftSide = (\!\(
\*SubscriptBox[\(\[PartialD]\), \(t\)]\(p[x, y, t]\)\) //. {p -> sol, 
     x -> xVal, y -> yVal, t -> tVal});
rightSide = (s*\!\(
\*SubscriptBox[\(\[PartialD]\), \(x, x\)]\(p[x, y, t]\)\) + s*\!\(
\*SubscriptBox[\(\[PartialD]\), \(y, y\)]\(p[x, y, t]\)\) - \!\(
\*SubscriptBox[\(\[PartialD]\), \(x\)]\((\((\((a*x^n)\)/\((S^n + 
             x^n)\) + \((b*S^n)\)/\((S^n + y^n)\) - k*x)\)*
        p[x, y, t])\)\) - \!\(
\*SubscriptBox[\(\[PartialD]\), \(y\)]\((\((\((\((a*y^n)\)/\((S^n + 
              y^n)\) + \((b*S^n)\)/\((S^n + x^n)\) - k*y)\))\)*
        p[x, y, t])\)\)) //. {p -> sol, x -> xVal, y -> yVal, 
    t -> tVal};

Print["Left side: ", leftSide];
Print["Right side: ", rightSide];

(* Left side: -3.92564*10^-7 *)

(* Right side: 0.0000816017 *)

The difference is not small. I'm not proficient with PDEs and now sure why. You should be able to study this code and test it at other points.
deleted 618 characters in body
Source Link
josh
  • 2.5k
  • 5
  • 18

You have many points that are negative leading to complex numbers when taking logs. Deleting these I suspect makes it difficult (or impossible) to interpolate between the real points in 3D. In the code below, I create a matrix of points {xEdited: Changed after studying solution

Plotting sol[x,y,8] below one sees it begins very small oscillations between positive and negative values assuming the machine-Log[sol[x,y,8]]} then rather than deleteprecision FEM method employed yields and accurate solution and the complex ones, just set them to zero to better visualize themoscillations aren't spurious. Next I extract the reals and One could back-substitue the complex points set to {a,b,0} separatelysolution to plot themcheck this. The Red points are Assuming the complex points. I'm not sure an interpolationsolution is indeed correct, then this is of course problematic if one is interested in taking the log of just the blue points insolution unless further processing of the figuresolution is possible. Maybe someone else can do thisacceptable such as using absolute values or other methods. Hope this helps better understand the problem

logTable = Table[
   {x, y, -Log[sol[x, y, 8]]},
   {x, 0, 3, 0.01},
   {y, 0, 3, 0.01}
   ];

realTable = Table[
   If[! Element[logTable[[i, j]], Reals],
    logTable[[i, j, 3]] = 0
    ];
   logTable[[i, j]],
   {i, 1, Length@logTable},
   {j, 1, Length@logTable[[i]]}
   ];

zeroList = Select[Flatten[realTable, 1], #[[3]] != 0 &];
complexList = Select[Flatten[realTable, 1], #[[3]] == 0 &];
ListPointPlot3D[{zeroList, complexList}, 
 PlotStyle -> {Automatic, LightRed}, BoxRatios -> {1, 1, 1}]

enter image description here

enter image description hereenter image description here

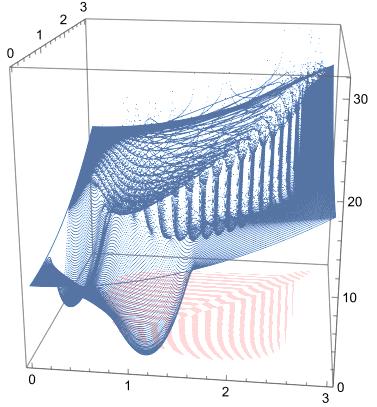
You have many points that are negative leading to complex numbers when taking logs. Deleting these I suspect makes it difficult (or impossible) to interpolate between the real points in 3D. In the code below, I create a matrix of points {x,y,-Log[sol[x,y,8]]} then rather than delete the complex ones, just set them to zero to better visualize them. Next I extract the reals and the complex points set to {a,b,0} separately to plot them. The Red points are the complex points. I'm not sure an interpolation of just the blue points in the figure is possible. Maybe someone else can do this. Hope this helps better understand the problem

logTable = Table[
   {x, y, -Log[sol[x, y, 8]]},
   {x, 0, 3, 0.01},
   {y, 0, 3, 0.01}
   ];

realTable = Table[
   If[! Element[logTable[[i, j]], Reals],
    logTable[[i, j, 3]] = 0
    ];
   logTable[[i, j]],
   {i, 1, Length@logTable},
   {j, 1, Length@logTable[[i]]}
   ];

zeroList = Select[Flatten[realTable, 1], #[[3]] != 0 &];
complexList = Select[Flatten[realTable, 1], #[[3]] == 0 &];
ListPointPlot3D[{zeroList, complexList}, 
 PlotStyle -> {Automatic, LightRed}, BoxRatios -> {1, 1, 1}]

enter image description here

Edited: Changed after studying solution

Plotting sol[x,y,8] below one sees it begins very small oscillations between positive and negative values assuming the machine-precision FEM method employed yields and accurate solution and the oscillations aren't spurious. One could back-substitue the solution to check this. Assuming the solution is indeed correct, then this is of course problematic if one is interested in taking the log of the solution unless further processing of the solution is acceptable such as using absolute values or other methods.

enter image description here

enter image description here

Source Link
josh
  • 2.5k
  • 5
  • 18

You have many points that are negative leading to complex numbers when taking logs. Deleting these I suspect makes it difficult (or impossible) to interpolate between the real points in 3D. In the code below, I create a matrix of points {x,y,-Log[sol[x,y,8]]} then rather than delete the complex ones, just set them to zero to better visualize them. Next I extract the reals and the complex points set to {a,b,0} separately to plot them. The Red points are the complex points. I'm not sure an interpolation of just the blue points in the figure is possible. Maybe someone else can do this. Hope this helps better understand the problem

logTable = Table[
   {x, y, -Log[sol[x, y, 8]]},
   {x, 0, 3, 0.01},
   {y, 0, 3, 0.01}
   ];

realTable = Table[
   If[! Element[logTable[[i, j]], Reals],
    logTable[[i, j, 3]] = 0
    ];
   logTable[[i, j]],
   {i, 1, Length@logTable},
   {j, 1, Length@logTable[[i]]}
   ];

zeroList = Select[Flatten[realTable, 1], #[[3]] != 0 &];
complexList = Select[Flatten[realTable, 1], #[[3]] == 0 &];
ListPointPlot3D[{zeroList, complexList}, 
 PlotStyle -> {Automatic, LightRed}, BoxRatios -> {1, 1, 1}]

enter image description here