added 10 characters in body
Source Link
kglr
  • 400.5k
  • 18
  • 488
  • 929

Update: If we extract Polygons (instead of FilledCurves) we can use many Mesh* and Region* functions on the extracted polygons:

SeedRandom[1];
cp = ContourPlot[Evaluate[Sum[Sin[RandomReal[5, 2] . {x, 5 y}], {10}]], 
  {x, 0, 5}, {y, 0, 5}, Contours -> 20, ContourShading -> None];


polygons = Cases[Normal@cp, 
   Line[x_] /; x[[{1, -1}, 1]] == {0., 0.} || x[[{1, -1}, 1]] == {5., 5.} :> 
    Polygon @ x, All];

Graphics[{RandomColor[], #} & /@ polygons]

enter image description here

largest20 = TakeLargestBy[polygons, Area, 20];

Graphics[{RandomColor[], #} & /@ largest20]

enter image description here

Multicolumn[DiscretizeRegion /@ largest20, 5]

enter image description here

Original answer:

Contour lines of a surface do not intersect.

So, we can take contour lines of a random surface and select the lines that start and end on the left or the right end of the horizontal range:

SeedRandom[1];
cp = ContourPlot[Evaluate[Sum[Sin[RandomReal[5, 2] . {x, 5 y}], {10}]], 
  {x, 0, 5}, {y, 0, 5}, Contours -> 20, ContourShading -> None];

Graphics @ Cases[Normal @ cp, 
  l : Line[x_] /; x[[{1, -1}, 1]] == {0., 0.} || x[[{1, -1}, 1]] == {5., 5.} :> 
  {RandomColor[], FilledCurve@l}, All] 

enter image description here

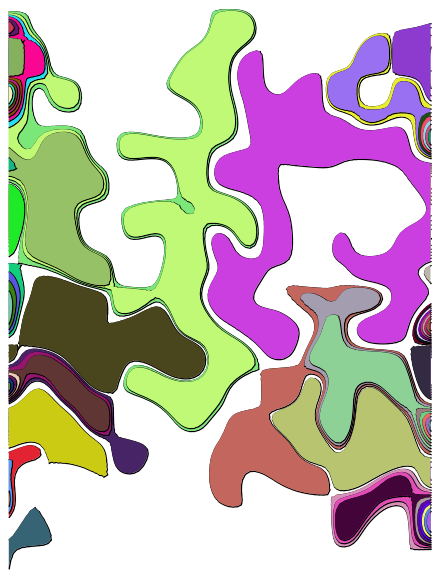
We can also use ListContourPlot:

SeedRandom[1];
lcp = ListContourPlot[RandomReal[{-.25, .25}, {20, 15}], 
   InterpolationOrder -> 3, Contours -> 20, ContourShading -> None];


Graphics @ Cases[Normal@lcp, 
  l : Line[x_] /; 
    x[[{1, -1}, 1]] == {1., 1.} || x[[{1, -1}, 1]] == {15., 15.} :>
    {l, RandomColor[], FilledCurve @ l}, All] 

enter image description here

Update: If we extract Polygons (instead of FilledCurves) we can use many Mesh* functions on the extracted polygons:

polygons = Cases[Normal@cp, 
   Line[x_] /; x[[{1, -1}, 1]] == {0., 0.} || x[[{1, -1}, 1]] == {5., 5.} :> 
    Polygon @ x, All];

Graphics[{RandomColor[], #} & /@ polygons]

enter image description here

largest20 = TakeLargestBy[polygons, Area, 20];

Graphics[{RandomColor[], #} & /@ largest20]

enter image description here

Multicolumn[DiscretizeRegion /@ largest20, 5]

enter image description here

Original answer:

Contour lines of a surface do not intersect.

So, we can take contour lines of a random surface and select the lines that start and end on the left or the right end of the horizontal range:

SeedRandom[1];
cp = ContourPlot[Evaluate[Sum[Sin[RandomReal[5, 2] . {x, 5 y}], {10}]], 
  {x, 0, 5}, {y, 0, 5}, Contours -> 20, ContourShading -> None];

Graphics @ Cases[Normal @ cp, 
  l : Line[x_] /; x[[{1, -1}, 1]] == {0., 0.} || x[[{1, -1}, 1]] == {5., 5.} :> 
  {RandomColor[], FilledCurve@l}, All] 

enter image description here

We can also use ListContourPlot:

SeedRandom[1];
lcp = ListContourPlot[RandomReal[{-.25, .25}, {20, 15}], 
   InterpolationOrder -> 3, Contours -> 20, ContourShading -> None];


Graphics @ Cases[Normal@lcp, 
  l : Line[x_] /; 
    x[[{1, -1}, 1]] == {1., 1.} || x[[{1, -1}, 1]] == {15., 15.} :>
    {l, RandomColor[], FilledCurve @ l}, All] 
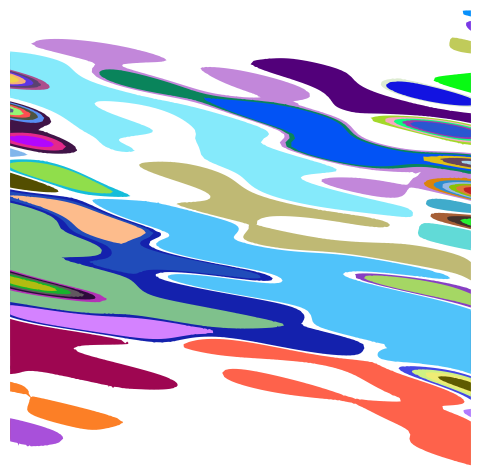
enter image description here

Update: If we extract Polygons (instead of FilledCurves) we can use many Mesh* and Region* functions on extracted polygons:

SeedRandom[1];
cp = ContourPlot[Evaluate[Sum[Sin[RandomReal[5, 2] . {x, 5 y}], {10}]], 
  {x, 0, 5}, {y, 0, 5}, Contours -> 20, ContourShading -> None];


polygons = Cases[Normal@cp, 
   Line[x_] /; x[[{1, -1}, 1]] == {0., 0.} || x[[{1, -1}, 1]] == {5., 5.} :> 
    Polygon @ x, All];

Graphics[{RandomColor[], #} & /@ polygons]

enter image description here

largest20 = TakeLargestBy[polygons, Area, 20];

Graphics[{RandomColor[], #} & /@ largest20]

enter image description here

Multicolumn[DiscretizeRegion /@ largest20, 5]

enter image description here

Original answer:

Contour lines of a surface do not intersect.

So, we can take contour lines of a random surface and select the lines that start and end on the left or the right end of the horizontal range:

SeedRandom[1];
cp = ContourPlot[Evaluate[Sum[Sin[RandomReal[5, 2] . {x, 5 y}], {10}]], 
  {x, 0, 5}, {y, 0, 5}, Contours -> 20, ContourShading -> None];

Graphics @ Cases[Normal @ cp, 
  l : Line[x_] /; x[[{1, -1}, 1]] == {0., 0.} || x[[{1, -1}, 1]] == {5., 5.} :> 
  {RandomColor[], FilledCurve@l}, All] 

enter image description here

We can also use ListContourPlot:

SeedRandom[1];
lcp = ListContourPlot[RandomReal[{-.25, .25}, {20, 15}], 
   InterpolationOrder -> 3, Contours -> 20, ContourShading -> None];


Graphics @ Cases[Normal@lcp, 
  l : Line[x_] /; 
    x[[{1, -1}, 1]] == {1., 1.} || x[[{1, -1}, 1]] == {15., 15.} :>
    {l, RandomColor[], FilledCurve @ l}, All] 
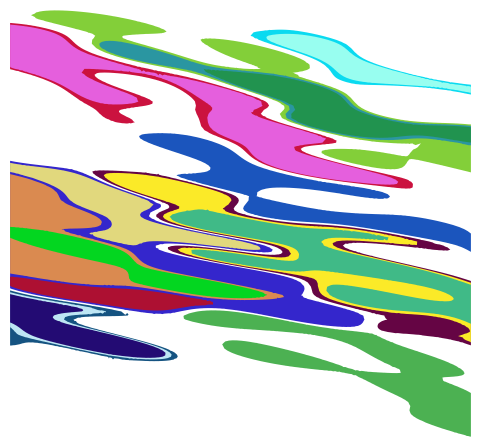
enter image description here

added 774 characters in body
Source Link
kglr
  • 400.5k
  • 18
  • 488
  • 929

Update: If we extract Polygons (instead of FilledCurves) we can use many Mesh* functions on the extracted polygons:

polygons = Cases[Normal@cp, 
   Line[x_] /; x[[{1, -1}, 1]] == {0., 0.} || x[[{1, -1}, 1]] == {5., 5.} :> 
    Polygon @ x, All];

Graphics[{RandomColor[], #} & /@ polygons]

enter image description here

largest20 = TakeLargestBy[polygons, Area, 20];

Graphics[{RandomColor[], #} & /@ largest20]

enter image description here

Multicolumn[DiscretizeRegion /@ largest20, 5]

enter image description here

Original answer:

Contour lines of a surface do not intersect.

So, we can take contour lines of a random surface and select the lines that start and end on the left or the right end of the horizontal range:

SeedRandom[1];
cp = ContourPlot[Evaluate[Sum[Sin[RandomReal[5, 2] . {x, 5 y}], {10}]], 
  {x, 0, 5}, {y, 0, 5}, Contours -> 20, ContourShading -> None];

Graphics @ Cases[Normal @ cp, 
  l : Line[x_] /; x[[{1, -1}, 1]] == {0., 0.} || x[[{1, -1}, 1]] == {5., 5.} :> 
  {RandomColor[], FilledCurve@l}, All] 

enter image description here

We can also use ListContourPlot:

SeedRandom[1];
lcp = ListContourPlot[RandomReal[{-.25, .25}, {20, 15}], 
   InterpolationOrder -> 3, Contours -> 20, ContourShading -> None];


Graphics @ Cases[Normal@lcp, 
  l : Line[x_] /; 
    x[[{1, -1}, 1]] == {1., 1.} || x[[{1, -1}, 1]] == {15., 15.} :>
    {l, RandomColor[], FilledCurve @ l}, All] 
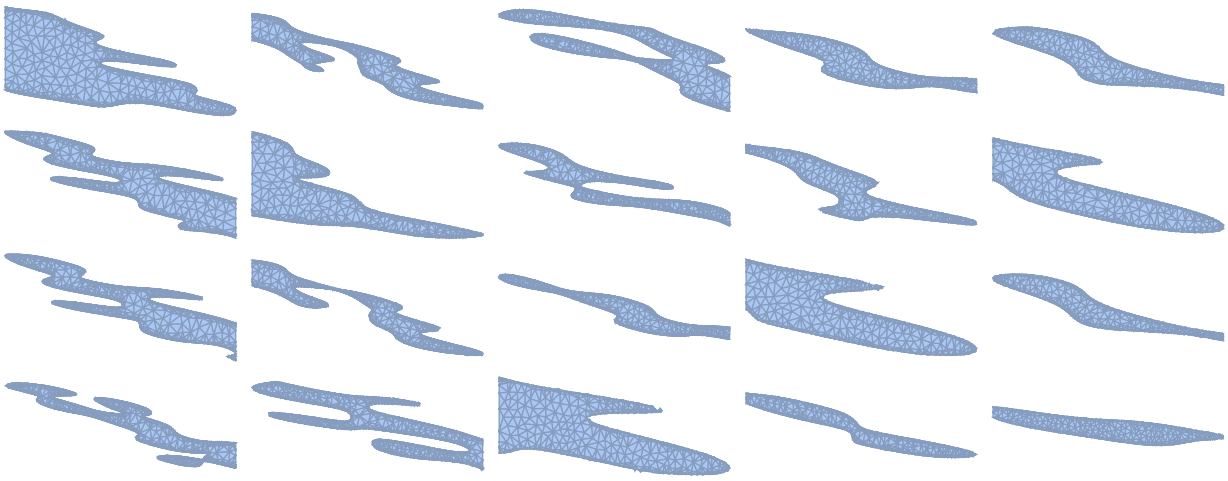
enter image description here

Contour lines of a surface do not intersect.

So, we can take contour lines of a random surface and select the lines that start and end on the left or the right end of the horizontal range:

SeedRandom[1];
cp = ContourPlot[Evaluate[Sum[Sin[RandomReal[5, 2] . {x, 5 y}], {10}]], 
  {x, 0, 5}, {y, 0, 5}, Contours -> 20, ContourShading -> None];

Graphics @ Cases[Normal @ cp, 
  l : Line[x_] /; x[[{1, -1}, 1]] == {0., 0.} || x[[{1, -1}, 1]] == {5., 5.} :> 
  {RandomColor[], FilledCurve@l}, All] 

enter image description here

We can also use ListContourPlot:

SeedRandom[1];
lcp = ListContourPlot[RandomReal[{-.25, .25}, {20, 15}], 
   InterpolationOrder -> 3, Contours -> 20, ContourShading -> None];


Graphics @ Cases[Normal@lcp, 
  l : Line[x_] /; 
    x[[{1, -1}, 1]] == {1., 1.} || x[[{1, -1}, 1]] == {15., 15.} :>
    {l, RandomColor[], FilledCurve @ l}, All] 
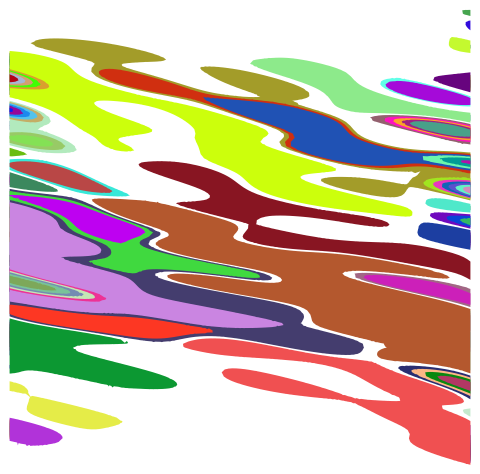
enter image description here

Update: If we extract Polygons (instead of FilledCurves) we can use many Mesh* functions on the extracted polygons:

polygons = Cases[Normal@cp, 
   Line[x_] /; x[[{1, -1}, 1]] == {0., 0.} || x[[{1, -1}, 1]] == {5., 5.} :> 
    Polygon @ x, All];

Graphics[{RandomColor[], #} & /@ polygons]

enter image description here

largest20 = TakeLargestBy[polygons, Area, 20];

Graphics[{RandomColor[], #} & /@ largest20]

enter image description here

Multicolumn[DiscretizeRegion /@ largest20, 5]

enter image description here

Original answer:

Contour lines of a surface do not intersect.

So, we can take contour lines of a random surface and select the lines that start and end on the left or the right end of the horizontal range:

SeedRandom[1];
cp = ContourPlot[Evaluate[Sum[Sin[RandomReal[5, 2] . {x, 5 y}], {10}]], 
  {x, 0, 5}, {y, 0, 5}, Contours -> 20, ContourShading -> None];

Graphics @ Cases[Normal @ cp, 
  l : Line[x_] /; x[[{1, -1}, 1]] == {0., 0.} || x[[{1, -1}, 1]] == {5., 5.} :> 
  {RandomColor[], FilledCurve@l}, All] 

enter image description here

We can also use ListContourPlot:

SeedRandom[1];
lcp = ListContourPlot[RandomReal[{-.25, .25}, {20, 15}], 
   InterpolationOrder -> 3, Contours -> 20, ContourShading -> None];


Graphics @ Cases[Normal@lcp, 
  l : Line[x_] /; 
    x[[{1, -1}, 1]] == {1., 1.} || x[[{1, -1}, 1]] == {15., 15.} :>
    {l, RandomColor[], FilledCurve @ l}, All] 
enter image description here

added 472 characters in body
Source Link
kglr
  • 400.5k
  • 18
  • 488
  • 929

Contour lines of a surface do not intersect.

So, we can take contour lines of a random surface and select the lines that start and end on the left or the right end of the horizontal range:

SeedRandom[1];
cp = ContourPlot[Evaluate[Sum[Sin[RandomReal[5, 2] . {x, 5 y}], {10}]], 
  {x, 0, 5}, {y, 0, 5}, Contours -> 20, ContourShading -> None];

Graphics @ Cases[Normal @ cp, 
  l : Line[x_] /; x[[{1, -1}, 1]] == {0., 0.} || x[[{1, -1}, 1]] == {5., 5.} :> 
  {RandomColor[], FilledCurve@l}, All] 

enter image description here

We can also use ListContourPlot:

SeedRandom[1];
lcp = ListContourPlot[RandomReal[{-.25, .25}, {20, 15}], 
   InterpolationOrder -> 3, Contours -> 20, ContourShading -> None];


Graphics @ Cases[Normal@lcp, 
  l : Line[x_] /; 
    x[[{1, -1}, 1]] == {1., 1.} || x[[{1, -1}, 1]] == {15., 15.} :>
    {l, RandomColor[], FilledCurve @ l}, All] 

enter image description here

Contour lines of a surface do not intersect.

So, we can take contour lines of a random surface and select the lines that start and end on the left or the right end of the horizontal range:

SeedRandom[1];
cp = ContourPlot[Evaluate[Sum[Sin[RandomReal[5, 2] . {x, 5 y}], {10}]], 
  {x, 0, 5}, {y, 0, 5}, Contours -> 20, ContourShading -> None];

Graphics @ Cases[Normal @ cp, 
  l : Line[x_] /; x[[{1, -1}, 1]] == {0., 0.} || x[[{1, -1}, 1]] == {5., 5.} :> 
  {RandomColor[], FilledCurve@l}, All] 

enter image description here

We can also use ListContourPlot:

SeedRandom[1];
lcp = ListContourPlot[RandomReal[{-.25, .25}, {20, 15}], 
   InterpolationOrder -> 3, Contours -> 20, ContourShading -> None];


Graphics @ Cases[Normal@lcp, 
  l : Line[x_] /; 
    x[[{1, -1}, 1]] == {1., 1.} || x[[{1, -1}, 1]] == {15., 15.} :>
    {l, RandomColor[], FilledCurve @ l}, All] 

enter image description here

added 192 characters in body
Source Link
kglr
  • 400.5k
  • 18
  • 488
  • 929
Loading
Source Link
kglr
  • 400.5k
  • 18
  • 488
  • 929
Loading