added 566 characters in body
Source Link
Daniel Huber
  • 56.4k
  • 2
  • 24
  • 66

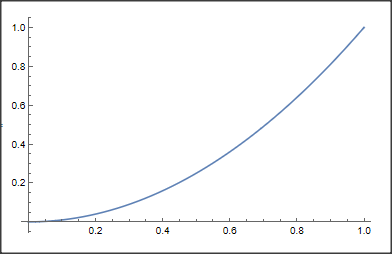
First we create the "preceding" plot:

pl1 = Plot[x^2, {x, 0, 1}]

enter image description here

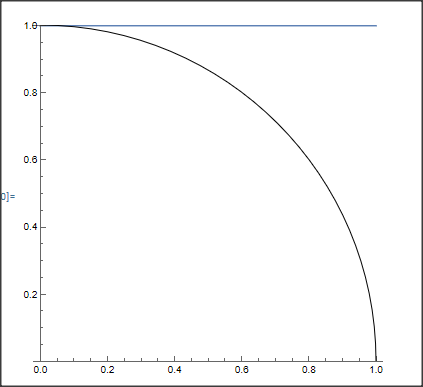
Now, to add a line we can simply plot a line. And the epilog can be added to this second plot. For an example, I choose a horizontal line and for the epilog a circle:

pl2 = Plot[1, {x, 0, 1}, Epilog -> Circle[], AspectRatio -> Automatic,

PlotRange -> {0, 1}]

enter image description here

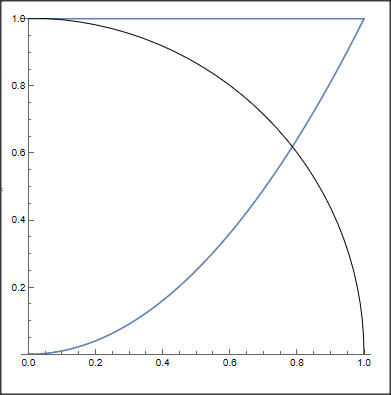
To show everything together we may use "Show". However, as options that appear first override options that appear later, we must specify plot2 first:

Show[pl2, pl1]

enter image description here

Addendum

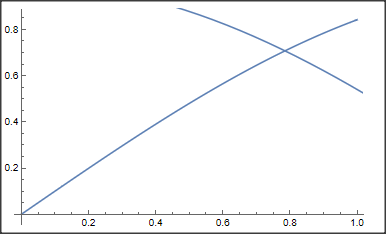
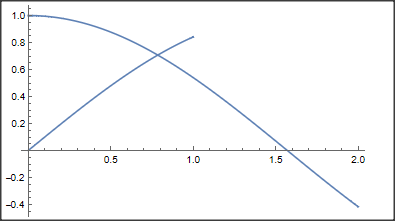
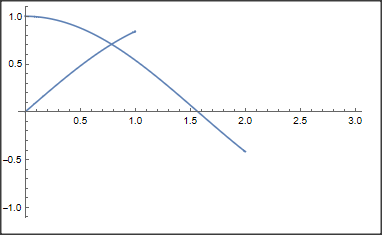
Concerning options, if there are different values for some options, the first one is taken. In addition, options can be overwritten in Show.

To give an example for different option values (here PlotRange) in Show:

Show[Plot[Sin[x], {x, 0, 1}], Plot[Cos[x], {x, 0, 2}]]
Show[Plot[Cos[x], {x, 0, 2}], Plot[Sin[x], {x, 0, 1}]]
Show[Plot[Cos[x], {x, 0, 2}], Plot[Sin[x], {x, 0, 1}], 
 PlotRange -> {{0, 3}, {-1, 1}}]

enter image description here

enter image description here

enter image description here

First we create the "preceding" plot:

pl1 = Plot[x^2, {x, 0, 1}]

enter image description here

Now, to add a line we can simply plot a line. And the epilog can be added to this second plot. For an example, I choose a horizontal line and for the epilog a circle:

pl2 = Plot[1, {x, 0, 1}, Epilog -> Circle[], AspectRatio -> Automatic,

PlotRange -> {0, 1}]

enter image description here

To show everything together we may use "Show". However, as options that appear first override options that appear later, we must specify plot2 first:

Show[pl2, pl1]

enter image description here

Addendum

Concerning options, if there are different values for some options, the first one is taken. In addition, options can be overwritten in Show.

To give an example for different option values (here PlotRange) in Show:

Show[Plot[Sin[x], {x, 0, 1}], Plot[Cos[x], {x, 0, 2}]]
Show[Plot[Cos[x], {x, 0, 2}], Plot[Sin[x], {x, 0, 1}]]
Show[Plot[Cos[x], {x, 0, 2}], Plot[Sin[x], {x, 0, 1}], 
 PlotRange -> {{0, 3}, {-1, 1}}]
enter image description here

enter image description here

enter image description here

Source Link
Daniel Huber
  • 56.4k
  • 2
  • 24
  • 66

First we create the "preceding" plot:

pl1 = Plot[x^2, {x, 0, 1}]

enter image description here

Now, to add a line we can simply plot a line. And the epilog can be added to this second plot. For an example, I choose a horizontal line and for the epilog a circle:

pl2 = Plot[1, {x, 0, 1}, Epilog -> Circle[], AspectRatio -> Automatic,

PlotRange -> {0, 1}]

enter image description here

To show everything together we may use "Show". However, as options that appear first override options that appear later, we must specify plot2 first:

Show[pl2, pl1]

enter image description here