Bumped by Community user
added 5 characters in body
Source Link

I am using Mathematica 13.2 on Ubuntu. I was trying to reproduce a plot that I made using Mathematica 12, but text symbols seem to not export correctly to PDF. This issue seems to apply to all non-letter/numerical symbols (e.g. parentheses, pound-signs, etc.)

I have boiled my problem down to a minimal-ish working example. Consider this simple plot of $\sin (x)$.

Plot[Sin[x], {x, -3, 3}
  , ImageSize -> Large
  , TicksStyle -> Directive[FontSize -> 25]
  , LabelStyle -> {Directive[FontSize -> 40, FontColor -> Black], 
    Directive[FontSize -> 40]}
  , AxesLabel -> {"x", 
    "\!\(\*SubscriptBox[\(\[Psi]\), \(\[Pi]\)]\)(x)"}
  , PlotRangePadding -> {0.2, 0.2}
  , PlotStyle -> {{Red, AbsoluteThickness[t1*1.5]}}
  , PlotLegends -> 
   LineLegend[{Directive[Red, AbsoluteThickness[t2]]}, 
    Style[#, 35, 
       FontFamily -> "Latin Modern Math"] & /@ {"Test (blep)"}, 
    LegendMarkerSize -> l]
  ] /. {t1 -> 3, t2 -> 6, l -> 40}

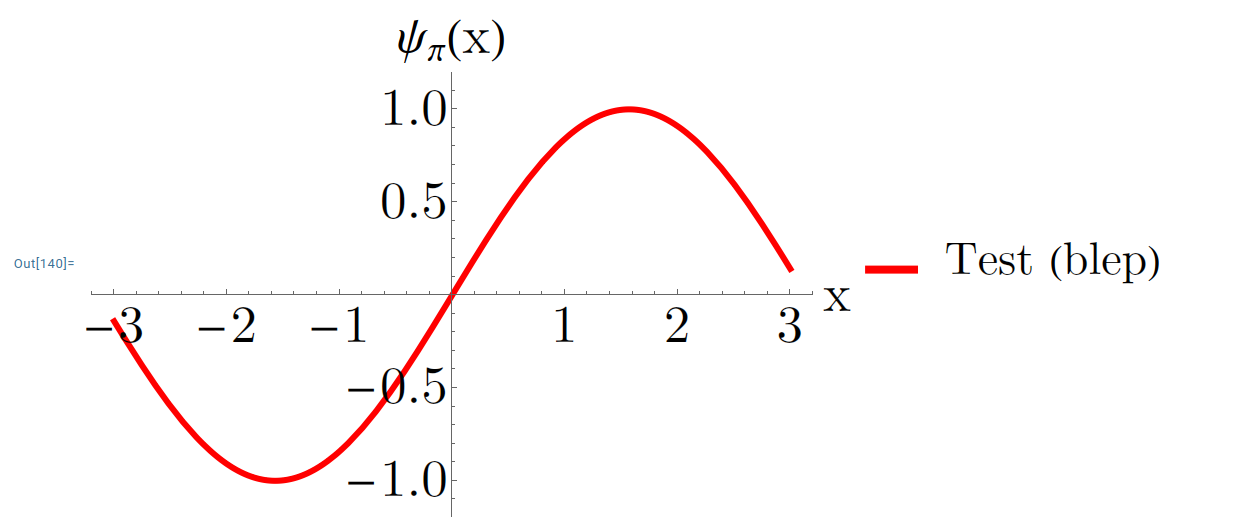
The plot that is generated in the Mathematica notebook is perfectly correct.

enter image description here

I then export this plot to PDF using the following command:

Export["/home/myComputer/test.pdf", %, "PDF"]

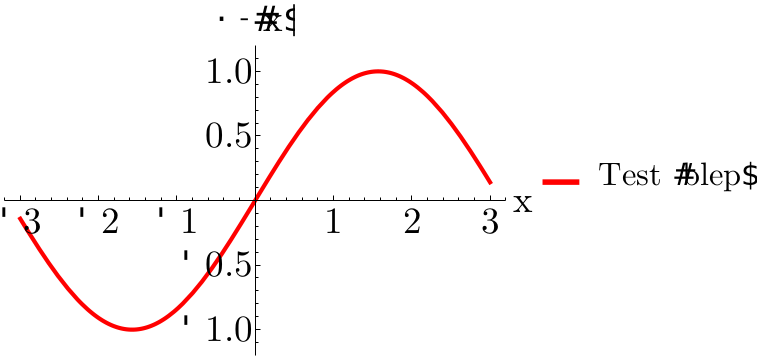
The plot in the generated PDF file does not have correct axes & legend labels. All symbols appear to be screwed up.

enter image description here

Any idea how to correct this?


Edit:

I have noticed that the error does not exist with other non-vector graphic types. For example, if I export to jpeg, gif, or png, the symbols show up correctly.

I am using Mathematica 13.2 on Ubuntu. I was trying to reproduce a plot that I made using Mathematica 12, but text symbols seem to not export correctly to PDF. This issue seems to apply to all non-letter/numerical symbols (e.g. parentheses, pound-signs, etc.)

I have boiled my problem down to a minimal-ish working example. Consider this simple plot of $\sin (x)$.

Plot[Sin[x], {x, -3, 3}
  , ImageSize -> Large
  , TicksStyle -> Directive[FontSize -> 25]
  , LabelStyle -> {Directive[FontSize -> 40, FontColor -> Black], 
    Directive[FontSize -> 40]}
  , AxesLabel -> {"x", 
    "\!\(\*SubscriptBox[\(\[Psi]\), \(\[Pi]\)]\)(x)"}
  , PlotRangePadding -> {0.2, 0.2}
  , PlotStyle -> {{Red, AbsoluteThickness[t1*1.5]}}
  , PlotLegends -> 
   LineLegend[{Directive[Red, AbsoluteThickness[t2]]}, 
    Style[#, 35, 
       FontFamily -> "Latin Modern Math"] & /@ {"Test (blep)"}, 
    LegendMarkerSize -> l]
  ] /. {t1 -> 3, t2 -> 6, l -> 40}

The plot that is generated in the Mathematica notebook is perfectly correct.

enter image description here

I then export this plot to PDF using the following command:

Export["/home/myComputer/test.pdf", %, "PDF"]

The plot in the generated PDF file does not have correct axes & legend labels. All symbols appear to be screwed up.

enter image description here

Any idea how to correct this?


Edit:

I have noticed that the error does not exist with other non-vector graphic types. For example, if I export to jpeg, gif, or png, the symbols show up correctly.
added 5 characters in body
Source Link

I am using Mathematica 13.2 on Ubuntu. I was trying to reproduce a plot that I made using Mathematica 12, but text symbols seem to not export correctly to PDF. This issue seems to apply to all non-letter/numerical symbols (e.g. parentheses, pound-signs, etc.)

I have boiled my problem down to a minimal-ish working example. Consider this simple plot of $\sin (x)$.

Plot[Sin[x], {x, -3, 3}
  , ImageSize -> Large
  , TicksStyle -> Directive[FontSize -> 25]
  , LabelStyle -> {Directive[FontSize -> 40, FontColor -> Black], 
    Directive[FontSize -> 40]}
  , AxesLabel -> {"x", 
    "\!\(\*SubscriptBox[\(\[Psi]\), \(\[Pi]\)]\)(x)"}
  , PlotRangePadding -> {0.2, 0.2}
  , PlotStyle -> {{Red, AbsoluteThickness[t1*1.5]}}
  , PlotLegends -> 
   LineLegend[{Directive[Red, AbsoluteThickness[t2]]}, 
    Style[#, 35, 
       FontFamily -> "Latin Modern Math"] & /@ {"Test (blep)"}, 
    LegendMarkerSize -> l]
  ] /. {t1 -> 3, t2 -> 6, l -> 40}

The plot that is generated in the Mathematica notebook is perfectly correct.

enter image description here

I then export this plot to PDF using the following command:

Export["/home/myComputer/test.pdf", %, "PDF"]

The plot in the generated PDF file does not have correct axes & legend labels. All symbols appear to be screwed up.

enter image description here

Any idea how to correct this?

I am using Mathematica 13.2 on Ubuntu. I was trying to reproduce a plot that I made using Mathematica 12, but text symbols seem to not export correctly to PDF.

I have boiled my problem down to a minimal-ish working example. Consider this simple plot of $\sin (x)$.

Plot[Sin[x], {x, -3, 3}
  , ImageSize -> Large
  , TicksStyle -> Directive[FontSize -> 25]
  , LabelStyle -> {Directive[FontSize -> 40, FontColor -> Black], 
    Directive[FontSize -> 40]}
  , AxesLabel -> {"x", 
    "\!\(\*SubscriptBox[\(\[Psi]\), \(\[Pi]\)]\)(x)"}
  , PlotRangePadding -> {0.2, 0.2}
  , PlotStyle -> {{Red, AbsoluteThickness[t1*1.5]}}
  , PlotLegends -> 
   LineLegend[{Directive[Red, AbsoluteThickness[t2]]}, 
    Style[#, 35, 
       FontFamily -> "Latin Modern Math"] & /@ {"Test (blep)"}, 
    LegendMarkerSize -> l]
  ] /. {t1 -> 3, t2 -> 6, l -> 40}

The plot that is generated in the Mathematica notebook is perfectly correct.

enter image description here

I then export this plot to PDF using the following command:

Export["/home/myComputer/test.pdf", %, "PDF"]

The plot in the generated PDF file does not have correct axes & legend labels. All symbols appear to be screwed up.

enter image description here

Any idea how to correct this?

I am using Mathematica 13.2 on Ubuntu. I was trying to reproduce a plot that I made using Mathematica 12, but text symbols seem to not export correctly to PDF. This issue seems to apply to all non-letter/numerical symbols (e.g. parentheses, pound-signs, etc.)

I have boiled my problem down to a minimal-ish working example. Consider this simple plot of $\sin (x)$.

Plot[Sin[x], {x, -3, 3}
  , ImageSize -> Large
  , TicksStyle -> Directive[FontSize -> 25]
  , LabelStyle -> {Directive[FontSize -> 40, FontColor -> Black], 
    Directive[FontSize -> 40]}
  , AxesLabel -> {"x", 
    "\!\(\*SubscriptBox[\(\[Psi]\), \(\[Pi]\)]\)(x)"}
  , PlotRangePadding -> {0.2, 0.2}
  , PlotStyle -> {{Red, AbsoluteThickness[t1*1.5]}}
  , PlotLegends -> 
   LineLegend[{Directive[Red, AbsoluteThickness[t2]]}, 
    Style[#, 35, 
       FontFamily -> "Latin Modern Math"] & /@ {"Test (blep)"}, 
    LegendMarkerSize -> l]
  ] /. {t1 -> 3, t2 -> 6, l -> 40}

The plot that is generated in the Mathematica notebook is perfectly correct.

enter image description here

I then export this plot to PDF using the following command:

Export["/home/myComputer/test.pdf", %, "PDF"]

The plot in the generated PDF file does not have correct axes & legend labels. All symbols appear to be screwed up.

enter image description here

Any idea how to correct this?

added 5 characters in body
Source Link

I am using Mathematica 13.2 on Ubuntu. I was trying to reproduce a plot that I made using Mathematica 12, but text symbols seem to not export correctly to PDF.

I have boiled my problem down to a minimal-ish working example. Consider this simple plot of $\sin (x)$.

Plot[Sin[x], {x, -3, 3}
  , ImageSize -> Large
  , TicksStyle -> Directive[FontSize -> 25]
  , LabelStyle -> {Directive[FontSize -> 40, FontColor -> Black], 
    Directive[FontSize -> 40]}
  , AxesLabel -> {"x", 
    "\!\(\*SubscriptBox[\(\[Psi]\), \(\[Pi]\)]\)(x)"}
  , PlotRangePadding -> {0.2, 0.2}
  , PlotStyle -> {{Red, AbsoluteThickness[t1*1.5]}}
  , PlotLegends -> 
   LineLegend[{Directive[Red, AbsoluteThickness[t2]]}, 
    Style[#, 35, 
       FontFamily -> "Latin Modern Math"] & /@ {"Test (blep)"}, 
    LegendMarkerSize -> l]
  ] /. {t1 -> 3, t2 -> 6, l -> 40}

The plot that is generated in the Mathematica notebook is perfectly correct.

enter image description here

I then export this plot to PDF using the following command:

Export["/home/myComputer/test.pdf", %, "PDF"]

The plot in the generated PDF file does not have correct axes & legend labels. All symbols appear to be screwed up.

enter image description here

Any idea how to correct this?

I am using Mathematica 13.2 on Ubuntu. I was trying to reproduce a plot that I made using Mathematica 12, but symbols seem to not export correctly to PDF.

I have boiled my problem down to a minimal-ish working example. Consider this simple plot of $\sin (x)$.

Plot[Sin[x], {x, -3, 3}
  , ImageSize -> Large
  , TicksStyle -> Directive[FontSize -> 25]
  , LabelStyle -> {Directive[FontSize -> 40, FontColor -> Black], 
    Directive[FontSize -> 40]}
  , AxesLabel -> {"x", 
    "\!\(\*SubscriptBox[\(\[Psi]\), \(\[Pi]\)]\)(x)"}
  , PlotRangePadding -> {0.2, 0.2}
  , PlotStyle -> {{Red, AbsoluteThickness[t1*1.5]}}
  , PlotLegends -> 
   LineLegend[{Directive[Red, AbsoluteThickness[t2]]}, 
    Style[#, 35, 
       FontFamily -> "Latin Modern Math"] & /@ {"Test (blep)"}, 
    LegendMarkerSize -> l]
  ] /. {t1 -> 3, t2 -> 6, l -> 40}

The plot that is generated in the Mathematica notebook is perfectly correct.

enter image description here

I then export this plot to PDF using the following command:

Export["/home/myComputer/test.pdf", %, "PDF"]

The plot in the generated PDF file does not have correct axes & legend labels. All symbols appear to be screwed up.

enter image description here

Any idea how to correct this?

I am using Mathematica 13.2 on Ubuntu. I was trying to reproduce a plot that I made using Mathematica 12, but text symbols seem to not export correctly to PDF.

I have boiled my problem down to a minimal-ish working example. Consider this simple plot of $\sin (x)$.

Plot[Sin[x], {x, -3, 3}
  , ImageSize -> Large
  , TicksStyle -> Directive[FontSize -> 25]
  , LabelStyle -> {Directive[FontSize -> 40, FontColor -> Black], 
    Directive[FontSize -> 40]}
  , AxesLabel -> {"x", 
    "\!\(\*SubscriptBox[\(\[Psi]\), \(\[Pi]\)]\)(x)"}
  , PlotRangePadding -> {0.2, 0.2}
  , PlotStyle -> {{Red, AbsoluteThickness[t1*1.5]}}
  , PlotLegends -> 
   LineLegend[{Directive[Red, AbsoluteThickness[t2]]}, 
    Style[#, 35, 
       FontFamily -> "Latin Modern Math"] & /@ {"Test (blep)"}, 
    LegendMarkerSize -> l]
  ] /. {t1 -> 3, t2 -> 6, l -> 40}

The plot that is generated in the Mathematica notebook is perfectly correct.

enter image description here

I then export this plot to PDF using the following command:

Export["/home/myComputer/test.pdf", %, "PDF"]

The plot in the generated PDF file does not have correct axes & legend labels. All symbols appear to be screwed up.

enter image description here

Any idea how to correct this?

Source Link
Loading