added graphic
Source Link
Sascha
  • 8.5k
  • 2
  • 34
  • 66

Imagine I have a set of data like the following:

data = {{0.0453803, 0.0427863, 0.0489815, 0.045243, 0.0488289, 0.0432898, 
  0.04448, 0.0387732, 0.0388952}, {0.0507668, 0.0427863, 0.0502632, 
  0.0503395, 0.0634623, 0.0675822, 0.0529335, 0.047425, 
  0.0387121}, {0.042237, 0.0501259, 0.0595712, 0.0869001, 0.139559, 
  0.141512, 0.0868391, 0.0579232, 0.0408331}, {0.0478981, 0.0491646, 
  0.0652628, 0.130404, 0.218448, 0.220645, 0.143603, 0.0605173, 
  0.0424964}, {0.0462043, 0.0530861, 0.076051, 0.140017, 0.206943, 
  0.202502, 0.118791, 0.0614023, 0.0459907}, {0.0511788, 0.0582132, 
  0.105531, 0.166354, 0.181003, 0.13698, 0.0748302, 0.0557107, 
  0.0492103}, {0.0493629, 0.0539712, 0.0971695, 0.160769, 0.164477, 
  0.104768, 0.0591745, 0.0475319, 0.0452583}, {0.0510719, 0.0599374, 
  0.0730602, 0.0975814, 0.101289, 0.0691997, 0.0498054, 0.044892, 
  0.043122}, {0.0460517, 0.0567025, 0.0574044, 0.0587778, 0.0537118, 
  0.0487221, 0.0474098, 0.0413977, 0.04477}}

I don't have enough reputation to post an image, but one can easily be generated by applying ListPlot3D to the above data set.plot of data
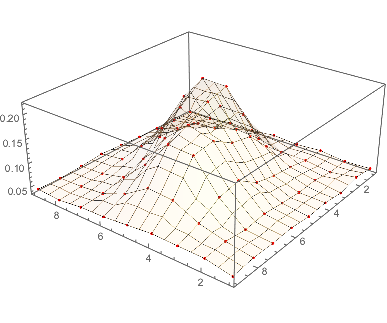
How might I best fit a Gaussian curve to this set of datapoints, and extract properties such at the fit' semi-axes? I noticed that ComponentMeasurements has some functionality for best fit ellipsoids, but that doesn't seem to be workable here.

My objective here is to determine how "Gaussian" a set of points in an image are. My strategy is to sequentially fit a 2D Gaussian to each point, and then to measure it's eccentricity and spread (looking, for example, at the length and ratio of the semiaxes of the ellipsoid corresponding to the fit). The example here seems like it should yield a 2D Gaussian fit with significant spread and a ratio for the semiaxes significantly diverging from one.

Imagine I have a set of data like the following:

data = {{0.0453803, 0.0427863, 0.0489815, 0.045243, 0.0488289, 0.0432898, 
  0.04448, 0.0387732, 0.0388952}, {0.0507668, 0.0427863, 0.0502632, 
  0.0503395, 0.0634623, 0.0675822, 0.0529335, 0.047425, 
  0.0387121}, {0.042237, 0.0501259, 0.0595712, 0.0869001, 0.139559, 
  0.141512, 0.0868391, 0.0579232, 0.0408331}, {0.0478981, 0.0491646, 
  0.0652628, 0.130404, 0.218448, 0.220645, 0.143603, 0.0605173, 
  0.0424964}, {0.0462043, 0.0530861, 0.076051, 0.140017, 0.206943, 
  0.202502, 0.118791, 0.0614023, 0.0459907}, {0.0511788, 0.0582132, 
  0.105531, 0.166354, 0.181003, 0.13698, 0.0748302, 0.0557107, 
  0.0492103}, {0.0493629, 0.0539712, 0.0971695, 0.160769, 0.164477, 
  0.104768, 0.0591745, 0.0475319, 0.0452583}, {0.0510719, 0.0599374, 
  0.0730602, 0.0975814, 0.101289, 0.0691997, 0.0498054, 0.044892, 
  0.043122}, {0.0460517, 0.0567025, 0.0574044, 0.0587778, 0.0537118, 
  0.0487221, 0.0474098, 0.0413977, 0.04477}}

I don't have enough reputation to post an image, but one can easily be generated by applying ListPlot3D to the above data set.

How might I best fit a Gaussian curve to this set of datapoints, and extract properties such at the fit' semi-axes? I noticed that ComponentMeasurements has some functionality for best fit ellipsoids, but that doesn't seem to be workable here.

My objective here is to determine how "Gaussian" a set of points in an image are. My strategy is to sequentially fit a 2D Gaussian to each point, and then to measure it's eccentricity and spread (looking, for example, at the length and ratio of the semiaxes of the ellipsoid corresponding to the fit). The example here seems like it should yield a 2D Gaussian fit with significant spread and a ratio for the semiaxes significantly diverging from one.

Imagine I have a set of data like the following:

data = {{0.0453803, 0.0427863, 0.0489815, 0.045243, 0.0488289, 0.0432898, 
  0.04448, 0.0387732, 0.0388952}, {0.0507668, 0.0427863, 0.0502632, 
  0.0503395, 0.0634623, 0.0675822, 0.0529335, 0.047425, 
  0.0387121}, {0.042237, 0.0501259, 0.0595712, 0.0869001, 0.139559, 
  0.141512, 0.0868391, 0.0579232, 0.0408331}, {0.0478981, 0.0491646, 
  0.0652628, 0.130404, 0.218448, 0.220645, 0.143603, 0.0605173, 
  0.0424964}, {0.0462043, 0.0530861, 0.076051, 0.140017, 0.206943, 
  0.202502, 0.118791, 0.0614023, 0.0459907}, {0.0511788, 0.0582132, 
  0.105531, 0.166354, 0.181003, 0.13698, 0.0748302, 0.0557107, 
  0.0492103}, {0.0493629, 0.0539712, 0.0971695, 0.160769, 0.164477, 
  0.104768, 0.0591745, 0.0475319, 0.0452583}, {0.0510719, 0.0599374, 
  0.0730602, 0.0975814, 0.101289, 0.0691997, 0.0498054, 0.044892, 
  0.043122}, {0.0460517, 0.0567025, 0.0574044, 0.0587778, 0.0537118, 
  0.0487221, 0.0474098, 0.0413977, 0.04477}}

plot of data

How might I best fit a Gaussian curve to this set of datapoints, and extract properties such at the fit' semi-axes? I noticed that ComponentMeasurements has some functionality for best fit ellipsoids, but that doesn't seem to be workable here.

My objective here is to determine how "Gaussian" a set of points in an image are. My strategy is to sequentially fit a 2D Gaussian to each point, and then to measure it's eccentricity and spread (looking, for example, at the length and ratio of the semiaxes of the ellipsoid corresponding to the fit). The example here seems like it should yield a 2D Gaussian fit with significant spread and a ratio for the semiaxes significantly diverging from one.

deleted 430 characters in body
Source Link
Bob
  • 761
  • 1
  • 5
  • 10

Question [June 3rd] How might I rescale and superimpose the mean of the fits suggested by Rahul Narain and Sjoerd C. de Vries on Image[data] where data is defined as below? I can't seem to get the change in coordinates right. Any help is much appreciated.

Note: I previously posted a version of this question without data. This is an attempt to reformulate and refocus my earlier question, and to provide example data.

Imagine I have a set of data like the following:

data = {{0.0453803, 0.0427863, 0.0489815, 0.045243, 0.0488289, 0.0432898, 
  0.04448, 0.0387732, 0.0388952}, {0.0507668, 0.0427863, 0.0502632, 
  0.0503395, 0.0634623, 0.0675822, 0.0529335, 0.047425, 
  0.0387121}, {0.042237, 0.0501259, 0.0595712, 0.0869001, 0.139559, 
  0.141512, 0.0868391, 0.0579232, 0.0408331}, {0.0478981, 0.0491646, 
  0.0652628, 0.130404, 0.218448, 0.220645, 0.143603, 0.0605173, 
  0.0424964}, {0.0462043, 0.0530861, 0.076051, 0.140017, 0.206943, 
  0.202502, 0.118791, 0.0614023, 0.0459907}, {0.0511788, 0.0582132, 
  0.105531, 0.166354, 0.181003, 0.13698, 0.0748302, 0.0557107, 
  0.0492103}, {0.0493629, 0.0539712, 0.0971695, 0.160769, 0.164477, 
  0.104768, 0.0591745, 0.0475319, 0.0452583}, {0.0510719, 0.0599374, 
  0.0730602, 0.0975814, 0.101289, 0.0691997, 0.0498054, 0.044892, 
  0.043122}, {0.0460517, 0.0567025, 0.0574044, 0.0587778, 0.0537118, 
  0.0487221, 0.0474098, 0.0413977, 0.04477}}

I don't have enough reputation to post an image, but one can easily be generated by applying ListPlot3D to the above data set.

How might I best fit a Gaussian curve to this set of datapoints, and extract properties such at the fit' semi-axes? I noticed that ComponentMeasurements has some functionality for best fit ellipsoids, but that doesn't seem to be workable here.

My objective here is to determine how "Gaussian" a set of points in an image are. My strategy is to sequentially fit a 2D Gaussian to each point, and then to measure it's eccentricity and spread (looking, for example, at the length and ratio of the semiaxes of the ellipsoid corresponding to the fit). The example here seems like it should yield a 2D Gaussian fit with significant spread and a ratio for the semiaxes significantly diverging from one.

added 251 characters in body
Source Link
Bob
  • 761
  • 1
  • 5
  • 10

Question [June 3rd] How might I rescale and superimpose the mean of the fits suggested by Rahul Narain and Sjoerd C. de Vries on Image[data] where data is defined as below? I can't seem to get the change in coordinates right. Any help is much appreciated.

Note: I previously posted a version of this question without data. This is an attempt to reformulate and refocus my earlier question, and to provide example data.

Imagine I have a set of data like the following:

data = {{0.0453803, 0.0427863, 0.0489815, 0.045243, 0.0488289, 0.0432898, 
  0.04448, 0.0387732, 0.0388952}, {0.0507668, 0.0427863, 0.0502632, 
  0.0503395, 0.0634623, 0.0675822, 0.0529335, 0.047425, 
  0.0387121}, {0.042237, 0.0501259, 0.0595712, 0.0869001, 0.139559, 
  0.141512, 0.0868391, 0.0579232, 0.0408331}, {0.0478981, 0.0491646, 
  0.0652628, 0.130404, 0.218448, 0.220645, 0.143603, 0.0605173, 
  0.0424964}, {0.0462043, 0.0530861, 0.076051, 0.140017, 0.206943, 
  0.202502, 0.118791, 0.0614023, 0.0459907}, {0.0511788, 0.0582132, 
  0.105531, 0.166354, 0.181003, 0.13698, 0.0748302, 0.0557107, 
  0.0492103}, {0.0493629, 0.0539712, 0.0971695, 0.160769, 0.164477, 
  0.104768, 0.0591745, 0.0475319, 0.0452583}, {0.0510719, 0.0599374, 
  0.0730602, 0.0975814, 0.101289, 0.0691997, 0.0498054, 0.044892, 
  0.043122}, {0.0460517, 0.0567025, 0.0574044, 0.0587778, 0.0537118, 
  0.0487221, 0.0474098, 0.0413977, 0.04477}}

I don't have enough reputation to post an image, but one can easily be generated by applying ListPlot3D to the above data set.

How might I best fit a Gaussian curve to this set of datapoints, and extract properties such at the fit' semi-axes? I noticed that ComponentMeasurements has some functionality for best fit ellipsoids, but that doesn't seem to be workable here.

My objective here is to determine how "Gaussian" a set of points in an image are. My strategy is to sequentially fit a 2D Gaussian to each point, and then to measure it's eccentricity and spread (looking, for example, at the length and ratio of the semiaxes of the ellipsoid corresponding to the fit). The example here seems like it should yield a 2D Gaussian fit with significant spread and a ratio for the semiaxes significantly diverging from one.

Question [June 3rd] How might I rescale and superimpose the mean of the fits suggested by Rahul Narain and Sjoerd C. de Vries on Image[data] where data is defined as below? I can't seem to get the change in coordinates right. Any help is much appreciated.

Note: I previously posted a version of this question without data. This is an attempt to reformulate and refocus my earlier question, and to provide example data.

Imagine I have a set of data like the following:

data = {{0.0453803, 0.0427863, 0.0489815, 0.045243, 0.0488289, 0.0432898, 
  0.04448, 0.0387732, 0.0388952}, {0.0507668, 0.0427863, 0.0502632, 
  0.0503395, 0.0634623, 0.0675822, 0.0529335, 0.047425, 
  0.0387121}, {0.042237, 0.0501259, 0.0595712, 0.0869001, 0.139559, 
  0.141512, 0.0868391, 0.0579232, 0.0408331}, {0.0478981, 0.0491646, 
  0.0652628, 0.130404, 0.218448, 0.220645, 0.143603, 0.0605173, 
  0.0424964}, {0.0462043, 0.0530861, 0.076051, 0.140017, 0.206943, 
  0.202502, 0.118791, 0.0614023, 0.0459907}, {0.0511788, 0.0582132, 
  0.105531, 0.166354, 0.181003, 0.13698, 0.0748302, 0.0557107, 
  0.0492103}, {0.0493629, 0.0539712, 0.0971695, 0.160769, 0.164477, 
  0.104768, 0.0591745, 0.0475319, 0.0452583}, {0.0510719, 0.0599374, 
  0.0730602, 0.0975814, 0.101289, 0.0691997, 0.0498054, 0.044892, 
  0.043122}, {0.0460517, 0.0567025, 0.0574044, 0.0587778, 0.0537118, 
  0.0487221, 0.0474098, 0.0413977, 0.04477}}

I don't have enough reputation to post an image, but one can easily be generated by applying ListPlot3D to the above data set.

How might I best fit a Gaussian curve to this set of datapoints, and extract properties such at the fit' semi-axes? I noticed that ComponentMeasurements has some functionality for best fit ellipsoids, but that doesn't seem to be workable here.

My objective here is to determine how "Gaussian" a set of points in an image are. My strategy is to sequentially fit a 2D Gaussian to each point, and then to measure it's eccentricity and spread (looking, for example, at the length and ratio of the semiaxes of the ellipsoid corresponding to the fit). The example here seems like it should yield a 2D Gaussian fit with significant spread and a ratio for the semiaxes significantly diverging from one.

Tweeted twitter.com/#!/StackMma/status/351658940209180672
deleted 360 characters in body
Source Link
Bob
  • 761
  • 1
  • 5
  • 10
Loading
added 360 characters in body
Source Link
Bob
  • 761
  • 1
  • 5
  • 10
Loading
added 456 characters in body
Source Link
Bob
  • 761
  • 1
  • 5
  • 10
Loading
Source Link
Bob
  • 761
  • 1
  • 5
  • 10
Loading