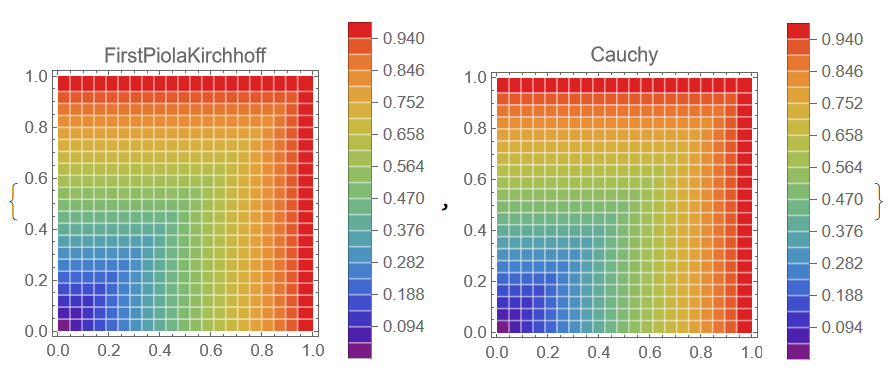
StressWe also can use stressMatrix to visualize the first Piola-Kirchhoff tensor as follows
ClearAll["Global`*"]
Needs["NDSolve`FEM`"]
QRElasticity[vars_, pars_, data_] :=
 Module[{ContourPlot[firstPK[[1u, x, dim, idm, n, Q, K0, M, G, F, FAni, R, sin\[Theta],
   cos\[Theta], a, b, \[Gamma], U, RU, \[Delta], \[CurlyEpsilon],
   pi, \[Sigma], \[Tau], STilde11, STilde22, STilde12, STilde,
   UInvTrans, stressMatrix}, u = vars[[1]];
  x = vars[[-1]];
  K0 = pars["BulkModulus"];
  M = pars["PWaveModulus"];
  G = pars["ShearModulus"];
  n = pars["n"];
  Q = pars["Q"];
  dim = Length[u];
  idm = IdentityMatrix[dim];
  (*Print["K = ",K];
  Print["M = ",M];
  Print["G = ",G];*)F = ConstantArray[0, {dim, dim}];
  F[[1 ;; dim, 1 ;; dim]] = idm + Grad[u, x];
  FAni = Q . F . Inverse[Q];
  (*Print["F =",F//MatrixForm];
  Print["FAni =",FAni//MatrixForm];*)
  R = ConstantArray[0, {dim, dim}];
  sin\[Theta] = -FAni[[2, 1]]/Sqrt[FAni[[1, 1]]^2 + FAni[[2, 1]]^2];
  cos\[Theta] = FAni[[1, 1]]/Sqrt[FAni[[1, 1]]^2 + FAni[[2, 1]]^2];
  R = {{cos\[Theta], sin\[Theta]}, {-sin\[Theta], cos\[Theta]}};
  (*Print["R = ",R//MatrixForm];*)
  a = Sqrt[FAni[[1, 1]]^2 + FAni[[2, 1]]^2];
  b = (FAni[[1, 1]] FAni[[2, 2]] - FAni[[1, 2]] FAni[[2, 1]])/
    Sqrt[FAni[[1, 1]]^2 + FAni[[2, 1]]^2];
  \[Gamma] = (FAni[[1, 1]] FAni[[1, 2]] +
      FAni[[2, 1]] FAni[[2, 2]])/(FAni[[1, 1]]^2 + FAni[[2, 1]]^2);
  U = {{a, a*\[Gamma]}, {0, b}};
  (*Print["U = ",U//MatrixForm];*)(*Print["RU = ",Simplify[R.U]//
  MatrixForm];*)\[Delta] = Log[Sqrt[a^n*b^(1/n)]];
  \[CurlyEpsilon] = Log[Sqrt[(a^n)/(b^(1/n))]];
  (*Print["delta = ",\[Delta]];
  Print["epsilon = ",\[CurlyEpsilon]];*)pi = 4*K0*\[Delta];
  \[Sigma] = 2*M*\[CurlyEpsilon];
  \[Tau] = G*\[Gamma];
  STilde11 = 1/2*(n*pi + n*\[Sigma]);
  STilde22 = 1/2*(pi/n - \[Sigma]/n);
  STilde12 = (b/a)*\[Tau];
  STilde = {{STilde11, STilde12}, {STilde12, STilde22}};
  (*Print["STilde = ",STilde//MatrixForm];*)
  UInvTrans = Inverse[Transpose[U]];
  (*Print["UInvTrans = ",UInvTrans//MatrixForm];*)
  stressMatrix = Inverse[Q] . R . STilde . UInvTrans . Q;
  stressMatrix = Simplify[stressMatrix[[1 ;; dim, 1 ;; dim]]];
  (*Print["StressMatrix = ",stressMatrix//MatrixForm];*)stressMatrix]

coords = {x, y};
deformation = {u[x, y], v[x, y]};
Young = 10^9;
\[Nu] = 1/3;

n = 1.5;
\[Alpha] = Pi/4;
Q = {{Cos[\[Alpha]], -Sin[\[Alpha]]}, {Sin[\[Alpha]], Cos[\[Alpha]]}};

GetK[Young_, \[Nu]_] := Young/(3*(1 - 2*\[Nu]));
GetM[Young_, \[Nu]_] :=
  Young*(1 - \[Nu])/((1 + \[Nu])*(1 - 2*\[Nu]));
GetG[Young_, \[Nu]_] := Young/(2*(1 + \[Nu]));

K0 = GetK[Young, \[Nu]];
M = GetM[Young, \[Nu]];
G = GetG[Young, \[Nu]];

rectangle = Rectangle[{0, 0}, {1, 1}];
mesh = ToElementMesh[rectangle];
vars = {deformation, coords};

pars = <|"MaterialModelFunction" -> QRElasticity,
   "ModelForm" -> "PlaneStrain", "Thickness" -> .01,
   "ConstitutiveStressMeasure" -> "FirstPiolaKirchhoff",
   "MassDensity" -> 980, "BulkModulus" -> K0, "PWaveModulus" -> M,
   "ShearModulus" -> G, "n" -> n, "Q" -> Q|>;
pdeQRElasticity = SolidMechanicsPDEComponent[vars, pars];
strain = SolidMechanicsStrain[vars, pars, deformation]; cauchy =
 SolidMechanicsStress[vars,
  Join[pars, <|"OutputStressMeasure" -> "Cauchy"|>], strain,
  deformation]; firstPK =
 SolidMechanicsStress[vars,
  Join[pars, <|"OutputStressMeasure" -> "FirstPiolaKirchhoff"|>],
  strain, deformation];
pde = {pdeQRElasticity ==
    SolidBoundaryLoadValue[x == 1, vars,
     pars, <|"Pressure" -> {p, 0}|>],
   DirichletCondition[{u[x, y] == 0}, x == 0],
   DirichletCondition[{v[x, y] == 0}, x == 0]};

sol = NDSolve[pde /. p -> 300000000, {u, v}, {x, y} \[Element] mesh];
Visualization
pars0 = <|"MassDensity" -> 980, "BulkModulus" -> K0,
   "PWaveModulus" -> M, "ShearModulus" -> G, "n" -> n, "Q" -> Q|>;

PK1=QRElasticity[vars, pars0, 0] /. sol[[1]];

{ContourPlot[PK1[[1, 1]], {x, y} \[Element] rectangle,
  PlotRange -> All, PlotLegends -> Automatic,
  ColorFunction -> "Rainbow", Contours -> 20, ContourStyle -> White,
  PlotLabel -> "FirstPiolaKirchhoff11"],
 ContourPlot[PK1[[1, 2]], {x, y} \[Element] rectangle,
  PlotRange -> All, PlotLegends -> Automatic,
  ColorFunction -> "Rainbow", Contours -> 20, ContourStyle -> White,
  PlotLabel -> "FirstPiolaKirchhoff"]"FirstPiolaKirchhoff12"],
 ContourPlot[cauchy[[1ContourPlot[PK1[[2, 2]], {x, y} \[Element] rectangle,
  PlotRange -> All, PlotLegends -> Automatic,
  ColorFunction -> "Rainbow", Contours -> 20, ContourStyle -> White,
  PlotLabel -> "Cauchy"]"FirstPiolaKirchhoff22"]}


