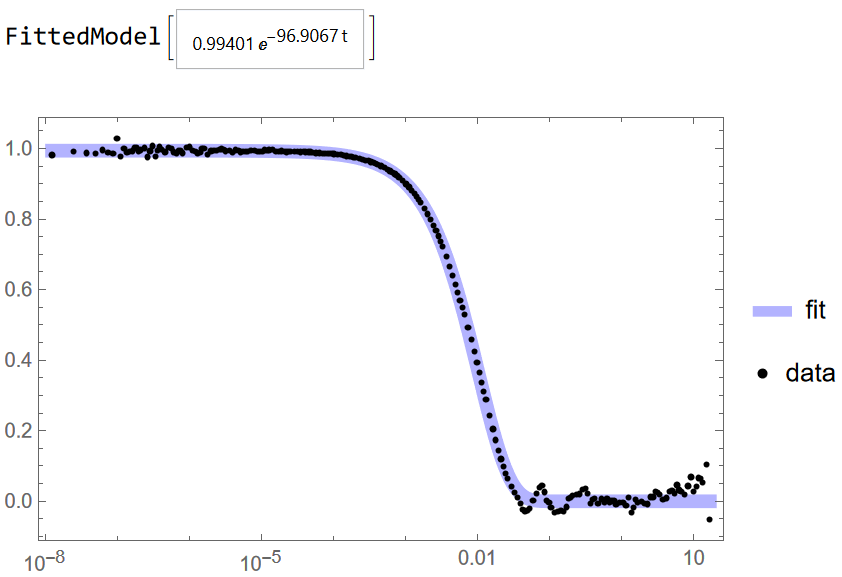
I think your proposed model may be inappropriate for your data. The main trend in your data is a simple exponential decay, whicha model that fits remarkably well:
nlm = NonlinearModelFit[data, beta Exp[-gamma t], {{beta, 1}, {gamma, 100}}, t]

Show[
  LogLinearPlot[
    Legended[nlm[t], "fit"], {t, data[[1, 1]], data[[-1, 1]]},
    Frame -> True, Axes -> False,
    PlotRange -> All,
    PlotStyle -> Directive[Opacity[0.3, Blue], Thickness[0.02]]
  ],
  ListLogLinearPlot[Legended[data, "data"], PlotStyle -> Black]
]
data comes from data = ImportString[" your data table minus the headers ", "Table"].

