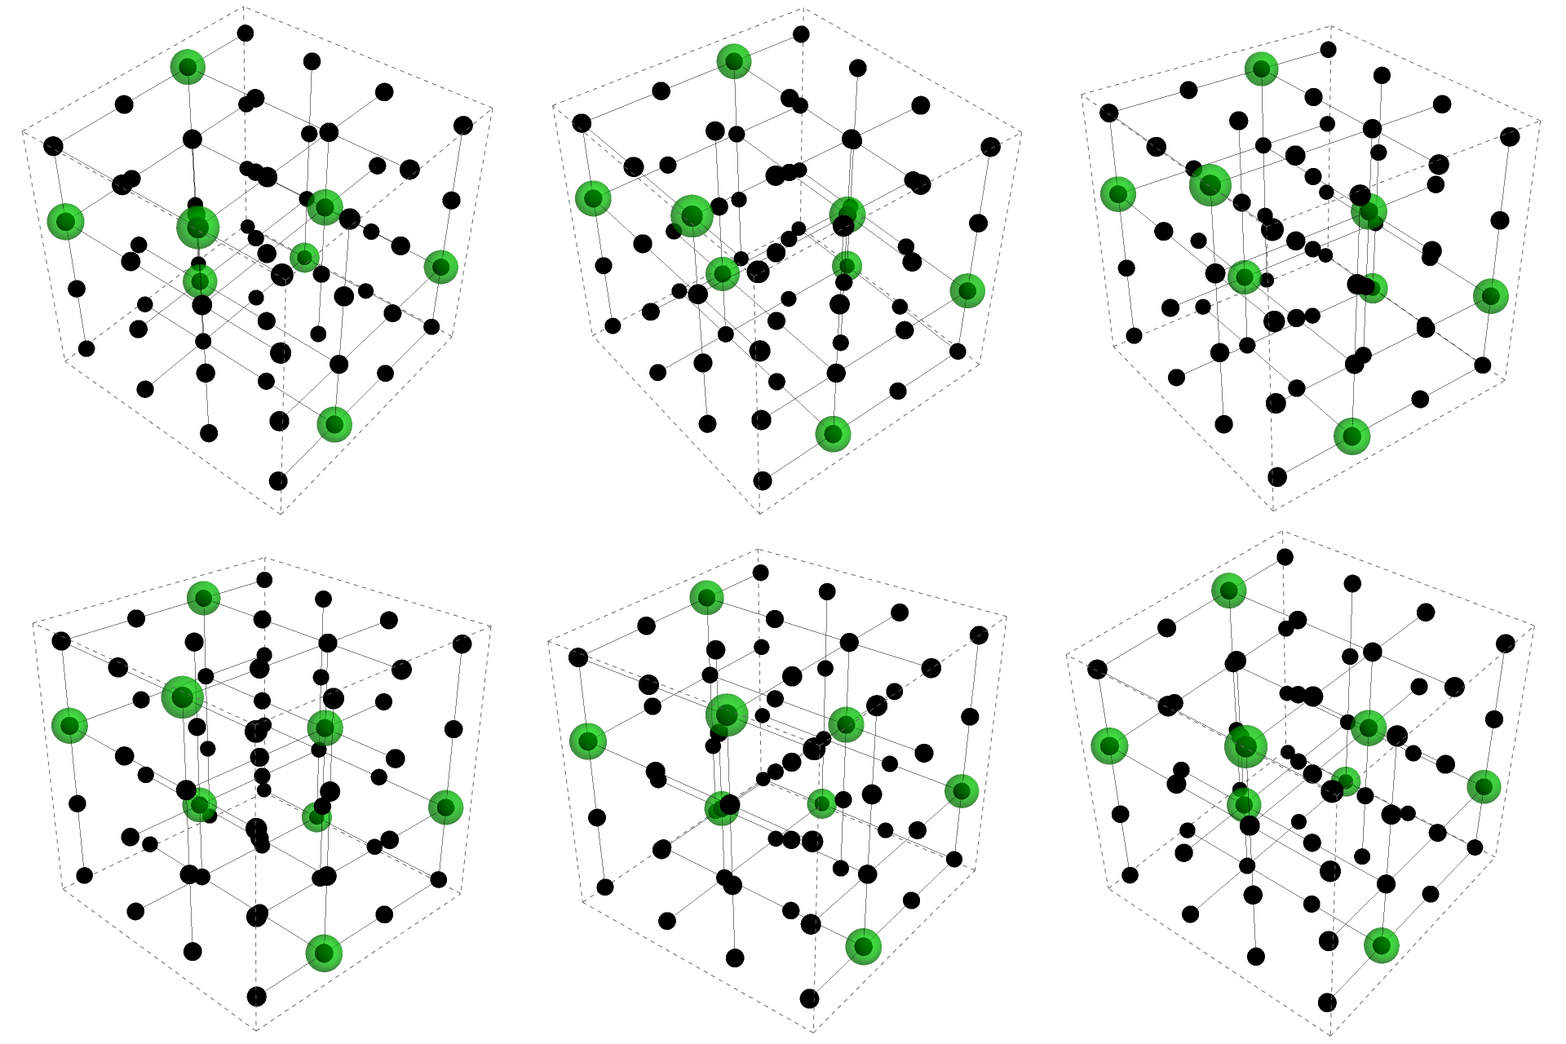
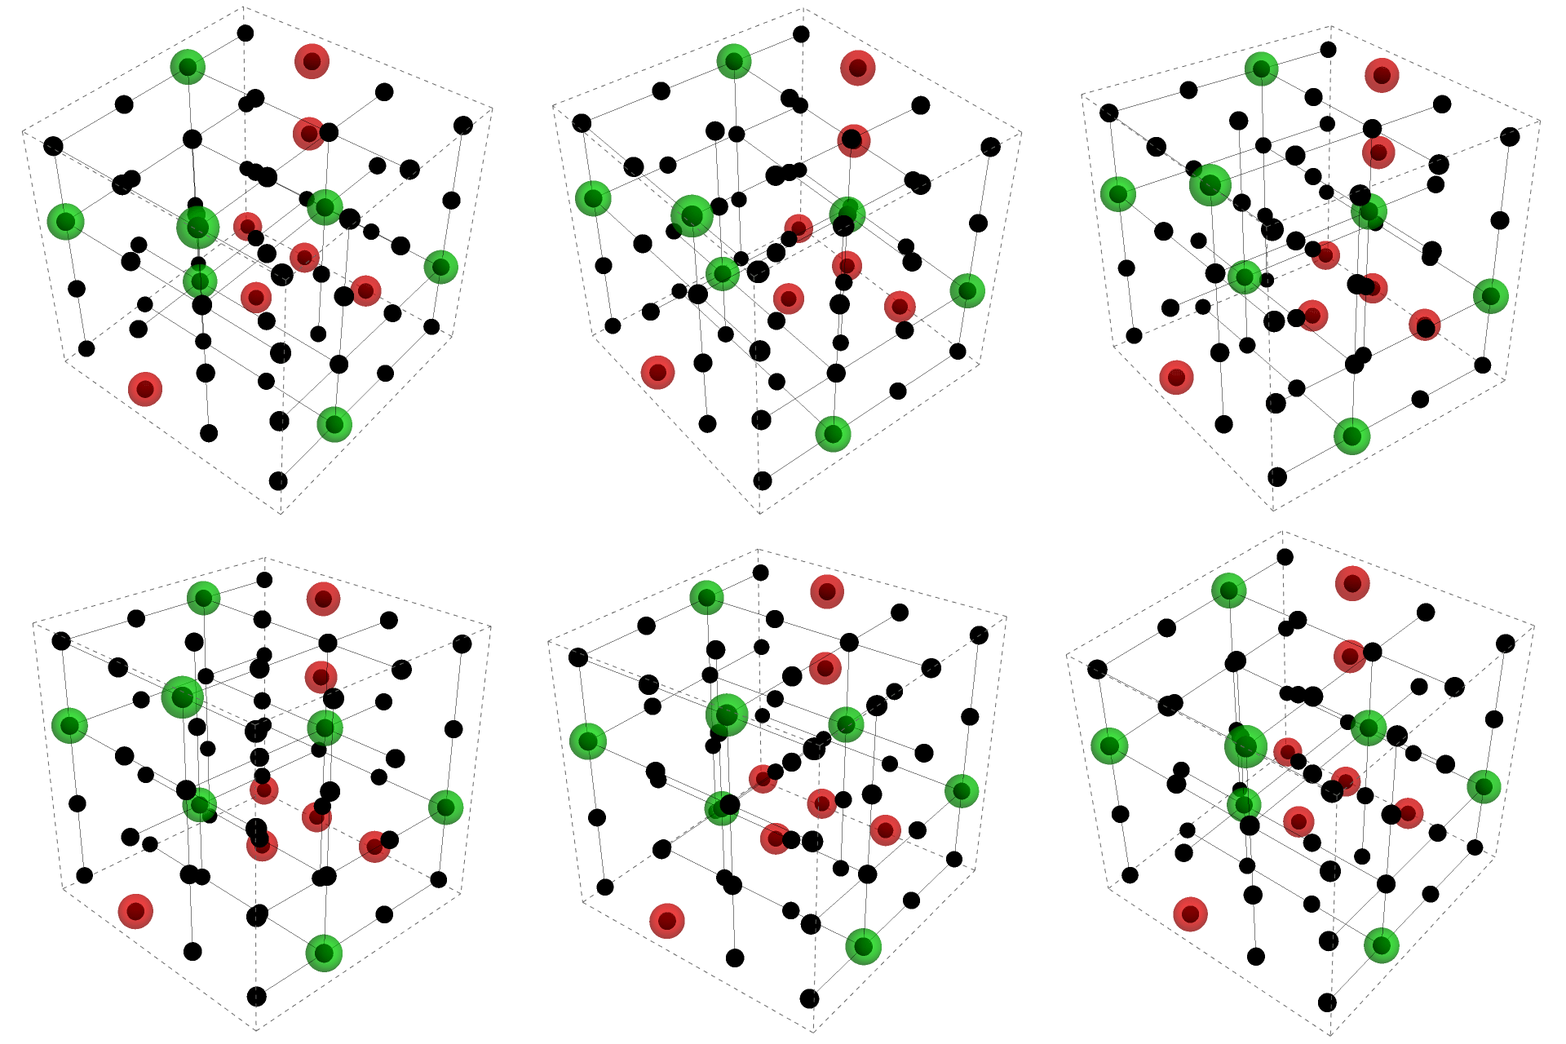
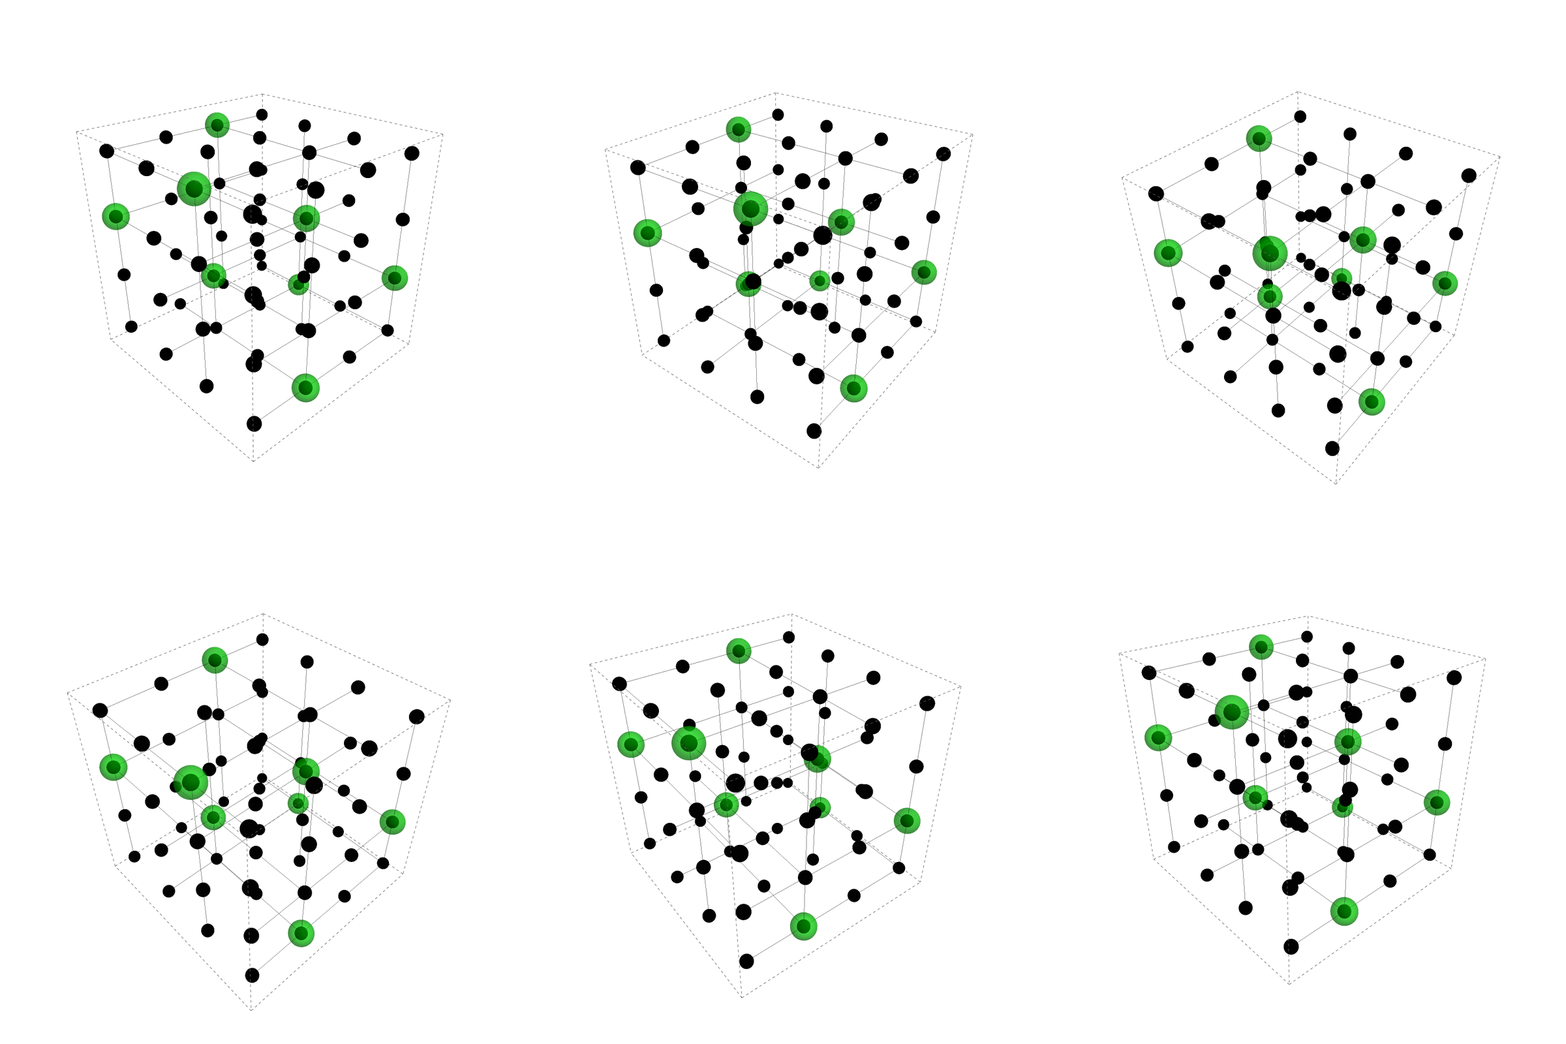
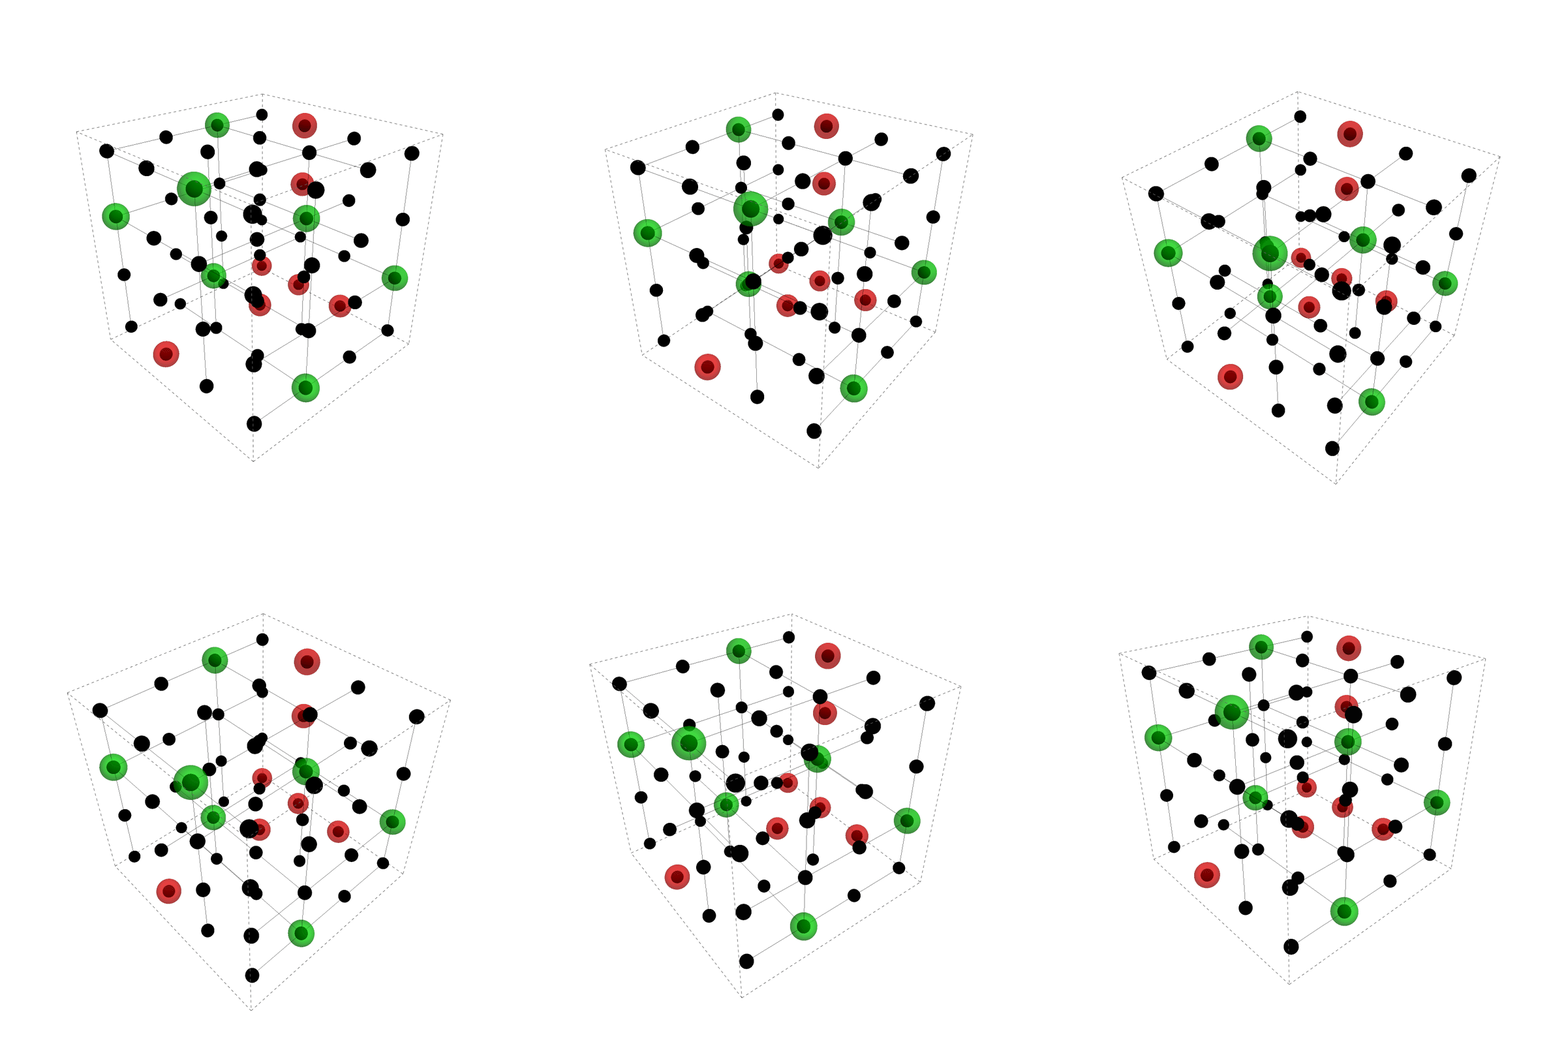
Regarding visualization you can do something like this:
n = 4;
p = {{2, 3, 0}, {1, 0, 3}, {2, 1, 1}, {3, 2, 3}, {3, 0, 2}, {1, 2,
     2}, {0, 3, 1}, {0, 1, 0}} + 1;
grid = Tuples[Range[n], {3}];
fp = Pick[
   grid, (d |-> (MemberQ[Count[d - #, 0] & /@ p, 2 | 3])) /@ grid,
   False];
Graphics3D[{{Black, Sphere[#, 1/10] & /@ grid}, {Opacity[0.5], Green,
   Sphere[#, 1/5] & /@ p}, {Opacity[0.5], Red,
   Sphere[#, 1/5] & /@ fp},
  Line /@ ({{{#1, #2, 1}, {#1, #2, n}}, {{#1, 1, #3}, {#1,
         n, #3}}, {{1, #2, #3}, {n, #2, #3}}} & @@@ p)},
 BoxStyle -> Dashed, SphericalRegion -> True]
Clear[n, grid, p, fp]
Green dots are covering set and red dots are points that were not covered.
In the first image we have 8 green dots and all points were covered, in the second one we have 7 green dots and 7 red dots that were not covered. Also take care that I use range of point's coordinates 1;;n instead of OP's 0;;n-1.


