The most direct way uses RegionPlot e.g.
RegionPlot[ g[x, y] > 0, {x, -0.5, 2.5}, {y, -0.5, 2.5}]
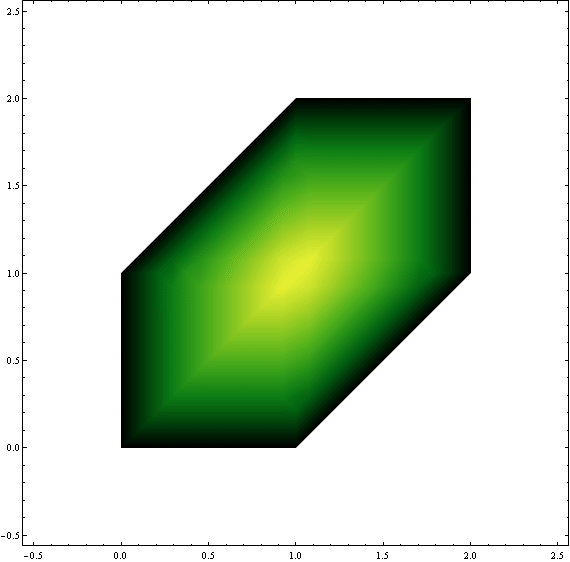
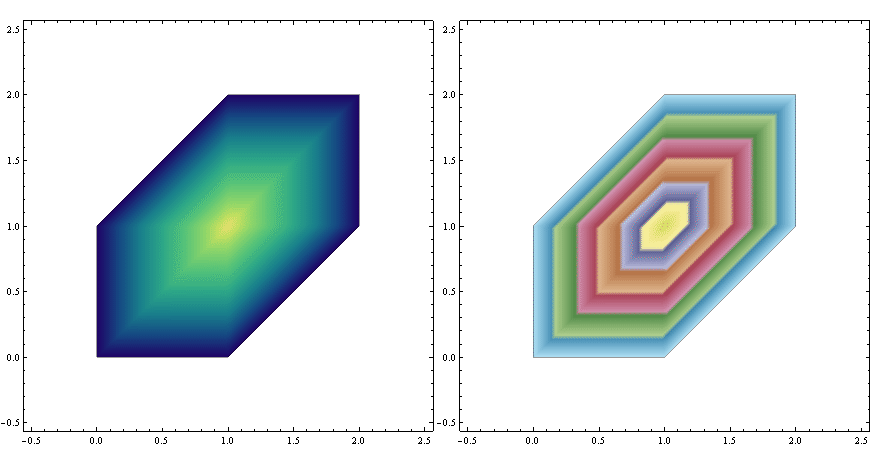
let's customize it a bit using colors from many possible ColorData["Gradients"]:
GraphicsRow[
    RegionPlot[ g[x, y] > 0, {x, -0.5, 2.5}, {y, -0.5, 2.5},
                ColorFunction -> Function[{x, y}, ColorData[#][Abs[g[x, y]]]],
                ColorFunctionScaling -> False, PlotPoints -> 100, MaxRecursion -> 5]& /@
    {"BlueGreenYellow", "DarkBands"} ]
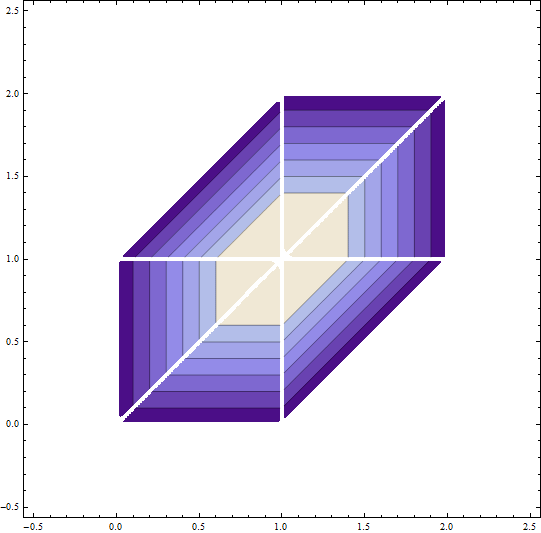
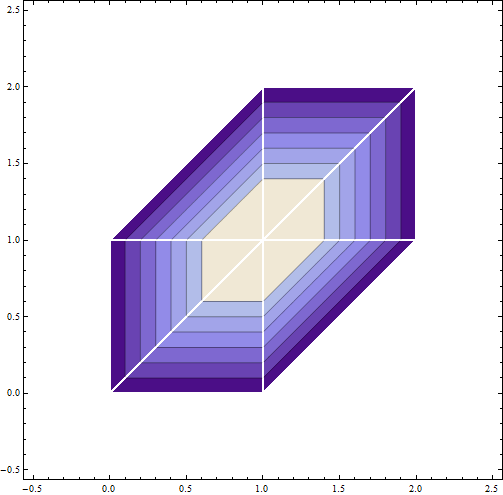
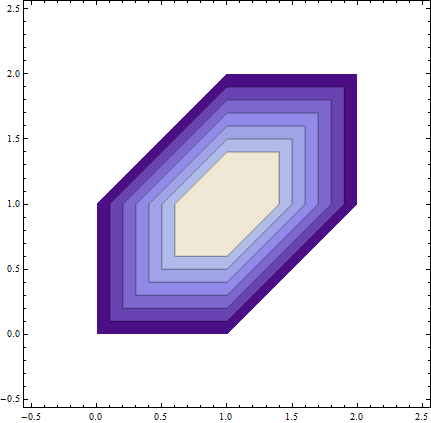
One can also get the plot with ContourPlot, e.g. using the RegionFunction option:
ContourPlot[ g[x, y], {x, -0.5, 2.5}, {y, -0.5, 2.5},
             RegionFunction -> Function[{x, y}, g[x, y] > 0],
             PlotPoints -> 80, MaxRecursionExclusions -> 4]None]
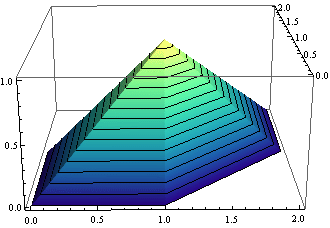
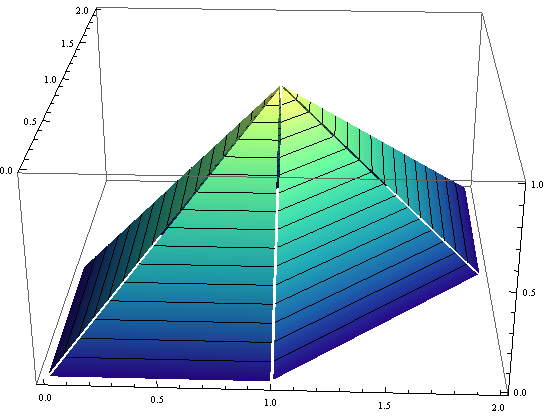
At last, we can make Plot3D better fitting to our needs:
Plot3D[ g[x, y], {x, -0.5, 2.5}, {y, -0.5, 2.5}, MeshFunctions -> {#3 &},
        PlotRange -> All, RegionFunction -> Function[{x, y}, g[x, y] > 0],
        ColorFunction -> Function[{x, y}, ColorData["BlueGreenYellow"][g[x, y]]],
        ColorFunctionScaling -> False, BoxRatios -> {2, 2, 1}, PlotPoints -> 80,
        MaxRecursion -> 4, Exclusions -> None]
