Tweeted twitter.com/StackMma/status/1531651742558998529
added 779 characters in body
Source Link
shanedrum
  • 587
  • 2
  • 8

Edit: Per MarcoB's comment, heres some examples of my attempts:

<< xAct`xCoba`
m = DefManifold[M, 4, {a, b, c}];
ch = DefChart[chart, M, {0, 1, 2, 3}, {e[], r[], t[], q[]}];
$LargeComponentSize = 1;
Column[{
  Row[{"xAct's representation of expression", Spacer[20], 
    CTensor[{{x + y, x + y, x + y, x + y}, {x + y, x + y, x + y, 
        x + y}, {x + y, x + y, x + y, x + y}, {x + y, x + y, x + y, 
        x + y}}, {chart, chart}][\[Mu]]}],
  Row[{"Iconize of expression", Spacer[20], 
    Table[Iconize[x + y], {i, 1, 4}, {j, 1, 4}] // MatrixForm}],
  Row[{"Use of Shallow function", Spacer[20], 
    Table[Shallow[x + y, 1], {i, 1, 4}, {j, 1, 4}] // MatrixForm}],
  Row[{"Normal expression", Spacer[20], 
    MatrixForm[{{x + y, x + y, x + y, x + y}, {x + y, x + y, x + y, 
       x + y}, {x + y, x + y, x + y, x + y}, {x + y, x + y, x + y, 
       x + y}}]}]
  }]

enter image description here

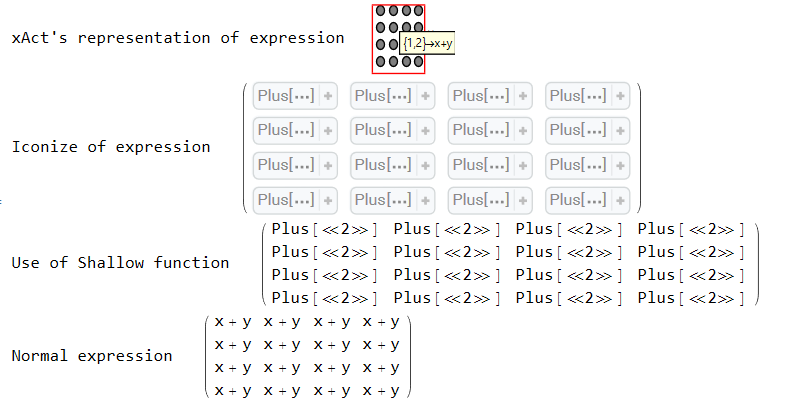
Top one is xActs representation of an expression using a symbol. Hovering the mouse over one of the symbols in the matrix prints the expression in a small prompt (in this case, the (1,2) component of the matrix holds the expression x+y).

Below that is my attempt using Iconize. Hovering the mouse over the Iconized expression doesnt print the expression in a small prompt, like xAct.

Below that is my attempt using Shallow[]. This just prints the first Head of the expression and the number of subexpressions with no way to see what the expression is without uniconizing.

Last one is the normal expression.

What I want to reproduce natively is xActs representation of the expression. Long expressions are replaced by a representative symbol and the expression can be seen by hovering the mouse over the symbol.

added 2 characters in body
Source Link
shanedrum
  • 587
  • 2
  • 8

The package xAct does something really nice when it handles Largelarge outputs, which is to represent the expression as a symbol and display that symbol when the cursor hovers over it. For example,

<< xAct`xCoba`
m = DefManifold[M, 4, {a, b, c}];
ch = DefChart[chart, M, {0, 1, 2, 3}, {e[], r[], t[], q[]}];
$LargeComponentSize = 1;
CTensor[{x + y}, {chart}][\[Mu]]

The expression x+y is mapped to a red symbolcircle, which displays the expression when you hover the mouse over it. I've been trying to figure out how to do this natively in Mathematica but have been unsuccessful. I've tried using Iconize, Short, and Shallow, but these dontdon't achieve what I want. How can I do this natively without utilizing any packages?

Thanks

The package xAct does something really nice when it handles Large outputs, which is to represent the expression as a symbol and display that symbol when the cursor hovers over it. For example

<< xAct`xCoba`
m = DefManifold[M, 4, {a, b, c}];
ch = DefChart[chart, M, {0, 1, 2, 3}, {e[], r[], t[], q[]}];
$LargeComponentSize = 1;
CTensor[{x + y}, {chart}][\[Mu]]

The expression x+y is mapped to a red symbol, which displays the expression when you hover the mouse over it. I've been trying to figure out how to do this natively in Mathematica but have been unsuccessful. I've tried using Iconize, Short, and Shallow, but these dont achieve what I want. How can I do this natively without utilizing any packages?

Thanks

The package xAct does something really nice when it handles large outputs, which is to represent the expression as a symbol and display that symbol when the cursor hovers over it. For example,

<< xAct`xCoba`
m = DefManifold[M, 4, {a, b, c}];
ch = DefChart[chart, M, {0, 1, 2, 3}, {e[], r[], t[], q[]}];
$LargeComponentSize = 1;
CTensor[{x + y}, {chart}][\[Mu]]

The expression x+y is mapped to a red circle, which displays the expression when you hover the mouse over it. I've been trying to figure out how to do this natively in Mathematica but have been unsuccessful. I've tried using Iconize, Short, and Shallow, but these don't achieve what I want. How can I do this natively without utilizing any packages?

Thanks

Source Link
shanedrum
  • 587
  • 2
  • 8

Symbolic representation of large output

The package xAct does something really nice when it handles Large outputs, which is to represent the expression as a symbol and display that symbol when the cursor hovers over it. For example

<< xAct`xCoba`
m = DefManifold[M, 4, {a, b, c}];
ch = DefChart[chart, M, {0, 1, 2, 3}, {e[], r[], t[], q[]}];
$LargeComponentSize = 1;
CTensor[{x + y}, {chart}][\[Mu]]

The expression x+y is mapped to a red symbol, which displays the expression when you hover the mouse over it. I've been trying to figure out how to do this natively in Mathematica but have been unsuccessful. I've tried using Iconize, Short, and Shallow, but these dont achieve what I want. How can I do this natively without utilizing any packages?

Thanks