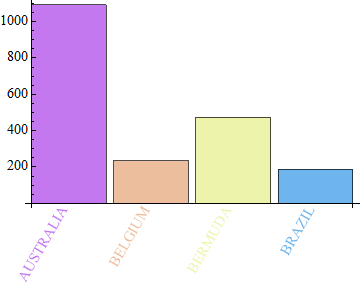
For Version 7
At least inIn version 7 the underlying Graphics expression that is produced by BarChart is highly conducive to a post-processing approach.
Each bar and label is contained in an expression that also includes style information.
The label however has an additional
Stylewrapper to effectively reset the color.To style the bars and labels similarly we need only to remove this undesired re-styling.
This can be accomplished with the following replacement rule:
Style[obj_, {GrayLevel[0]}] :> obj
Complete:
totals4 = {{1093, "AUSTRALIA"}, {235, "BELGIUM"}, {474, "BERMUDA"}, {187, "BRAZIL"}};

BarChart[#, ChartStyle -> "Pastel",
    ChartLabels -> (Placed[Rotate[#, Pi/3] & /@ #2, {{.5, 0}, {1, 1}}])] & @@
  Transpose[totals4] /. Style[obj_, {GrayLevel[0]}] :> obj

The rule may need to be change for the output in other Mathematica versions, or it may need to be made more specific if you have other objects with an explicit style of {GrayLevel[0]} in the chart. An example of a more restrictive pattern that might be needed is:
Text[Style[obj_, {GrayLevel[0]}], pos__] :> Text[obj, pos]
