Added more general case
Source Link
MarcoB
  • 67.7k
  • 18
  • 96
  • 198
list = {2, 4, 6, 8};
ListPlot[Labeled[#, #, Center]& /@ list, PlotStyle -> None]

labeled plot


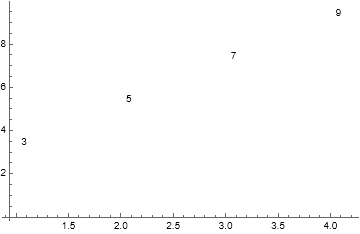
In the more general case in which coordinate pairs are specified, then the expression becomes:

dataXY = {{1, 3}, {2, 5}, {3, 7}, {4, 9}};
ListPlot[
  Labeled[#, #[[2]]] & /@ dataXY,
  PlotStyle -> None
]

scatter plot using (x,y) coordinates and showing y value as label

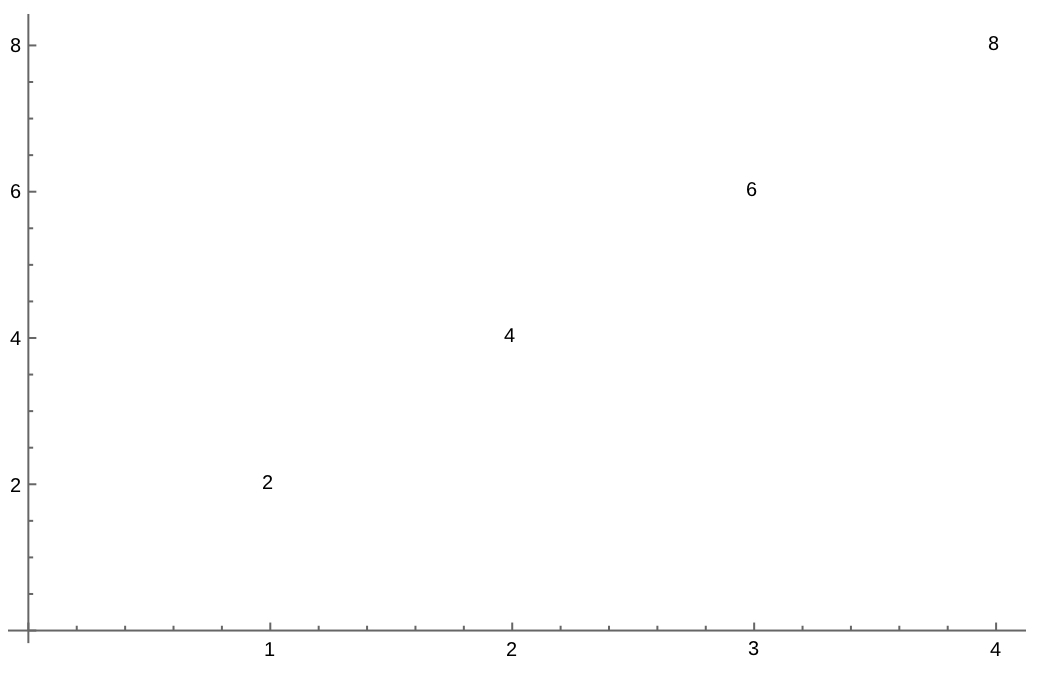
list = {2, 4, 6, 8};
ListPlot[Labeled[#, #, Center]& /@ list, PlotStyle -> None]

labeled plot

list = {2, 4, 6, 8};
ListPlot[Labeled[#, #, Center]& /@ list, PlotStyle -> None]

labeled plot


In the more general case in which coordinate pairs are specified, then the expression becomes:

dataXY = {{1, 3}, {2, 5}, {3, 7}, {4, 9}};
ListPlot[
  Labeled[#, #[[2]]] & /@ dataXY,
  PlotStyle -> None
]
scatter plot using (x,y) coordinates and showing y value as label

Source Link
MarcoB
  • 67.7k
  • 18
  • 96
  • 198

list = {2, 4, 6, 8};
ListPlot[Labeled[#, #, Center]& /@ list, PlotStyle -> None]

labeled plot