Changed ViewPoint on Plot3D
Source Link
Bob Hanlon
  • 162.7k
  • 7
  • 81
  • 205
Clear["Global`*"]

f[x_, y_] = ArcCos[x*y];

fd = FunctionDomain[f[x, y], {x, y}, Reals]

(* -1 <= x y <= 1 *)

RegionPlot[fd, {x, -5, 5}, {y, -5, 5},
 PlotPoints -> 50,
 MaxRecursion -> 5,
 FrameLabel -> Automatic]
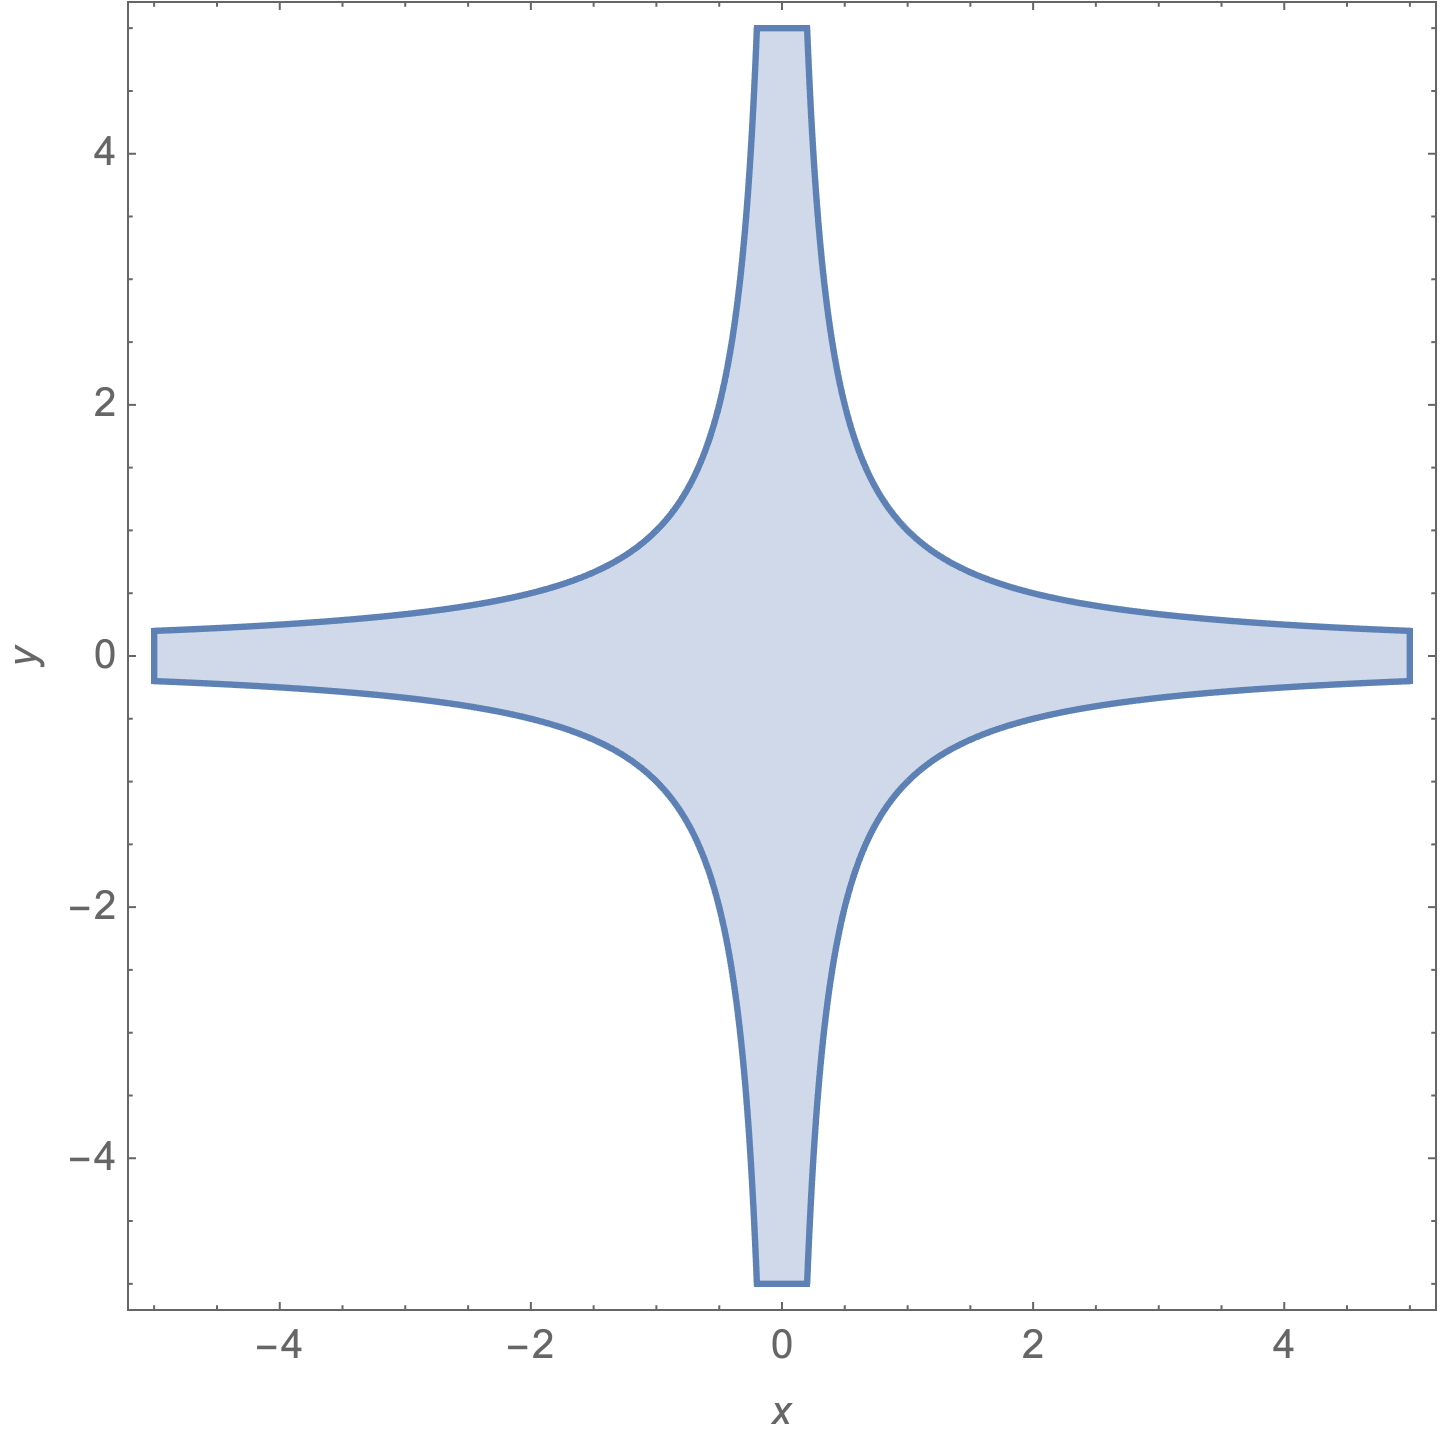
enter image description here

Plot3D[f[x, y], {x, -5, 5}, {y, -5, 5},
 ViewPoint -> Above{0, 0, Infinity},
 AxesLabel -> Automatic]
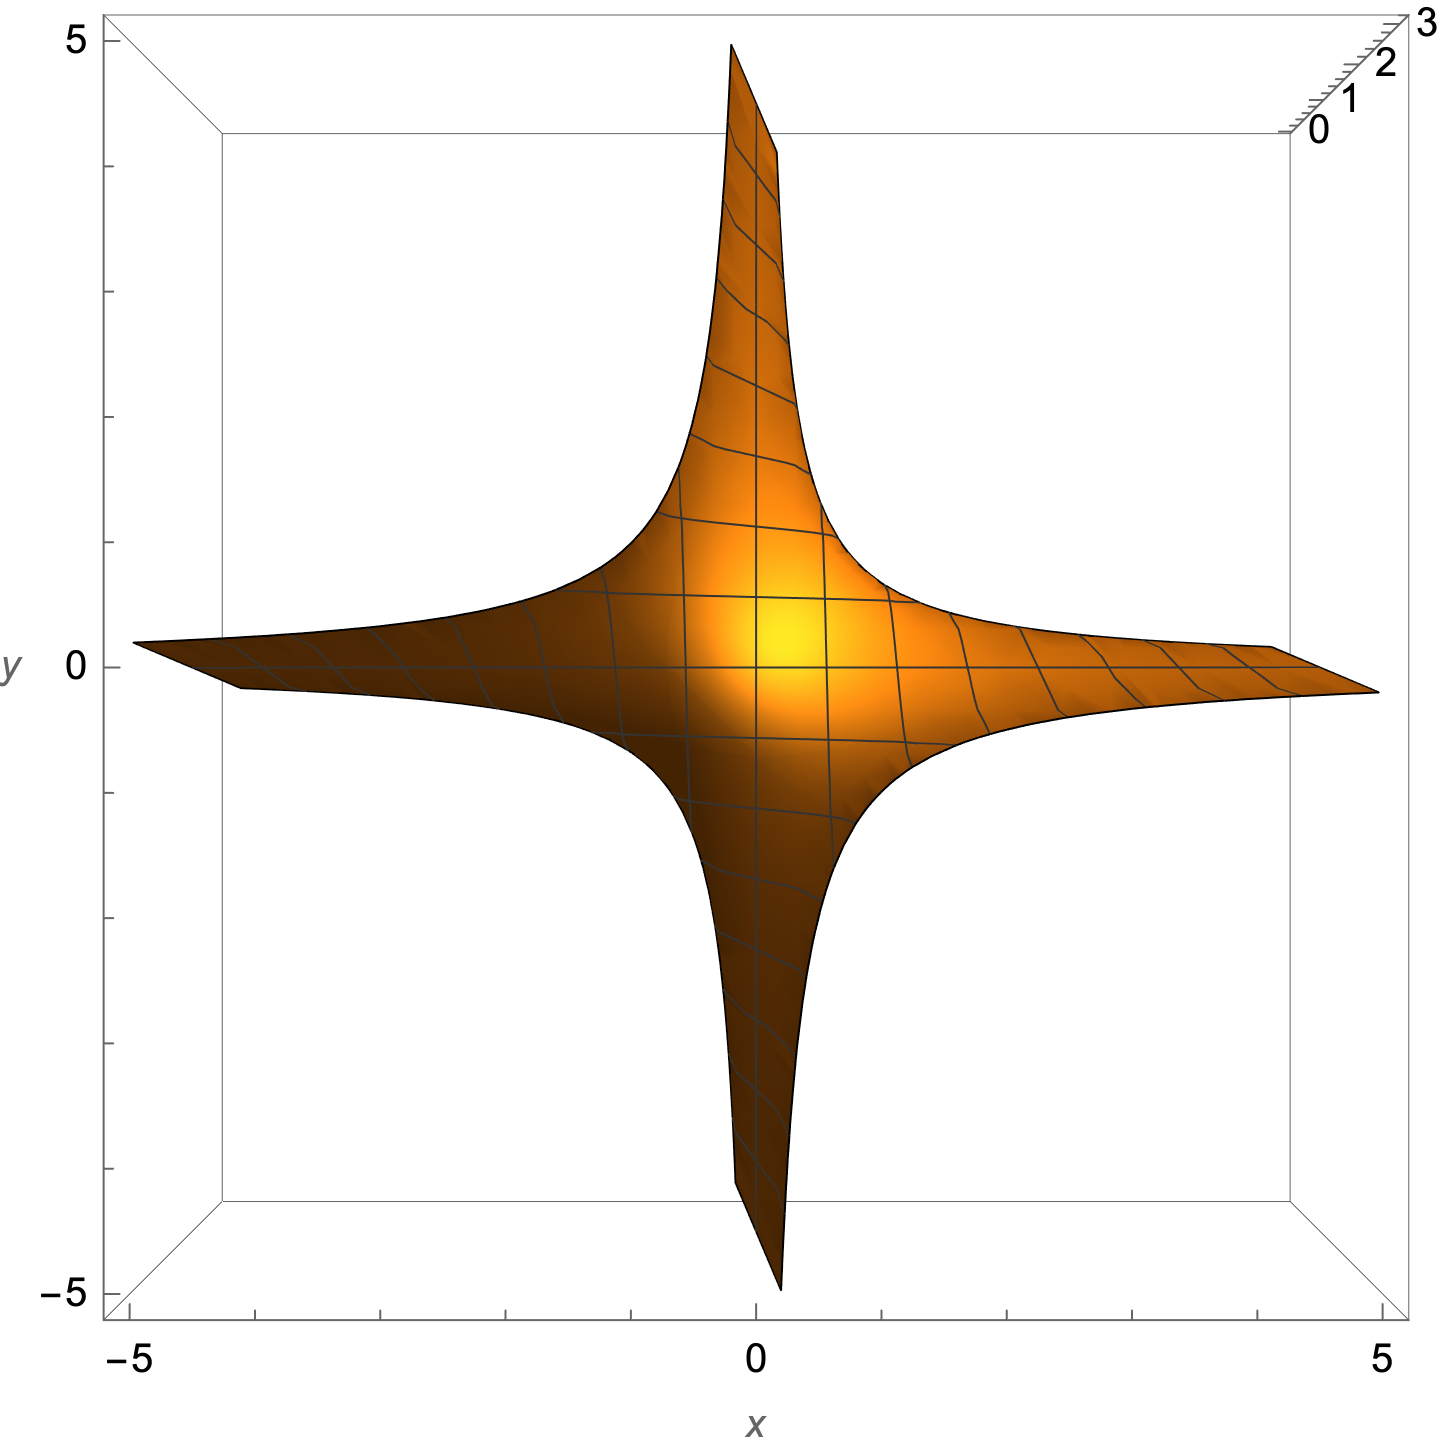
enter image description hereenter image description here

ContourPlot[x*y, {x, -5, 5}, {y, -5, 5},
 Contours -> {-1, 1},
 ContourShading -> {White, LightBlue},
 FrameLabel -> Automatic]

enter image description here

DensityPlot[f[x, y], {x, -5, 5}, {y, -5, 5},
 FrameLabel -> Automatic]

enter image description here

Clear["Global`*"]

f[x_, y_] = ArcCos[x*y];

fd = FunctionDomain[f[x, y], {x, y}, Reals]

(* -1 <= x y <= 1 *)

RegionPlot[fd, {x, -5, 5}, {y, -5, 5},
 PlotPoints -> 50,
 MaxRecursion -> 5,
 FrameLabel -> Automatic]

enter image description here

Plot3D[f[x, y], {x, -5, 5}, {y, -5, 5},
 ViewPoint -> Above,
 AxesLabel -> Automatic]

enter image description here

ContourPlot[x*y, {x, -5, 5}, {y, -5, 5},
 Contours -> {-1, 1},
 ContourShading -> {White, LightBlue},
 FrameLabel -> Automatic]

enter image description here

DensityPlot[f[x, y], {x, -5, 5}, {y, -5, 5},
 FrameLabel -> Automatic]

enter image description here

Clear["Global`*"]

f[x_, y_] = ArcCos[x*y];

fd = FunctionDomain[f[x, y], {x, y}, Reals]

(* -1 <= x y <= 1 *)

RegionPlot[fd, {x, -5, 5}, {y, -5, 5},
 PlotPoints -> 50,
 MaxRecursion -> 5,
 FrameLabel -> Automatic]

enter image description here

Plot3D[f[x, y], {x, -5, 5}, {y, -5, 5},
 ViewPoint -> {0, 0, Infinity},
 AxesLabel -> Automatic]
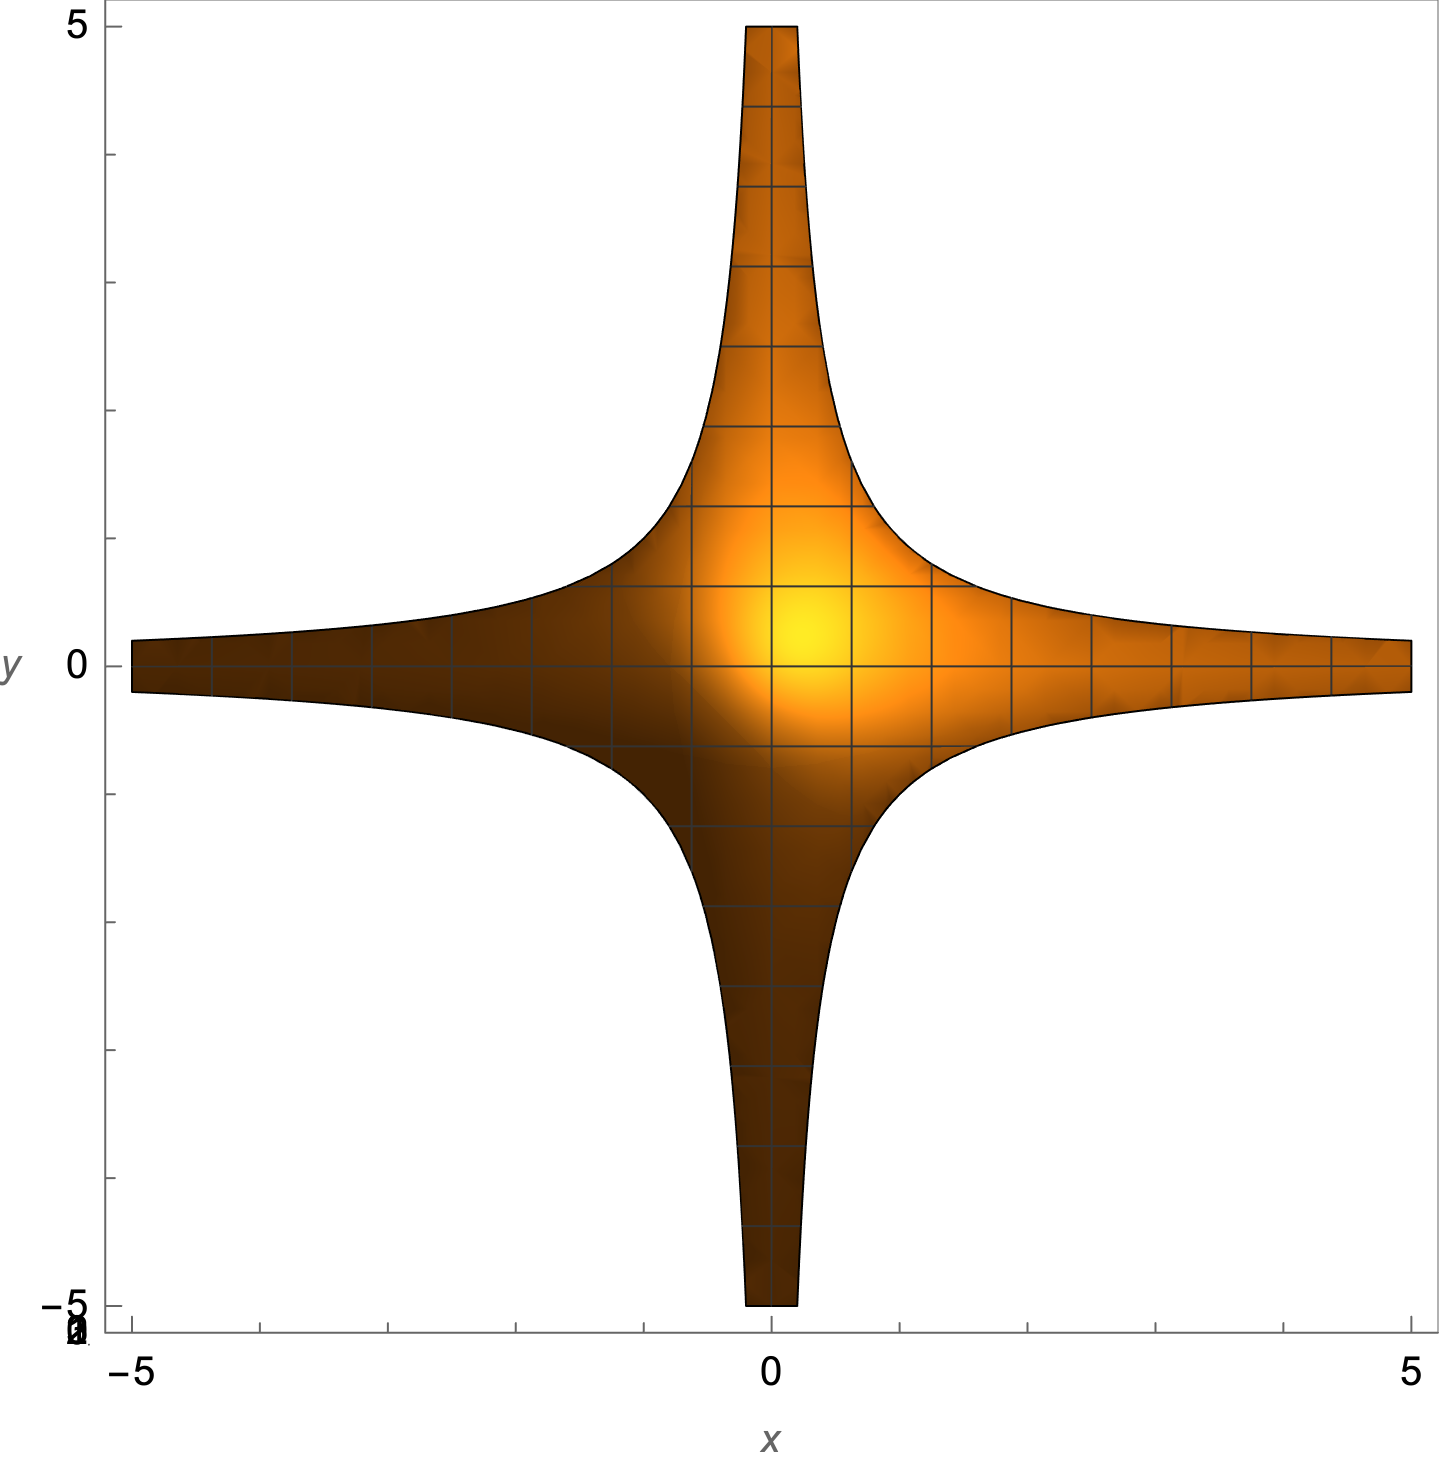
enter image description here

ContourPlot[x*y, {x, -5, 5}, {y, -5, 5},
 Contours -> {-1, 1},
 ContourShading -> {White, LightBlue},
 FrameLabel -> Automatic]
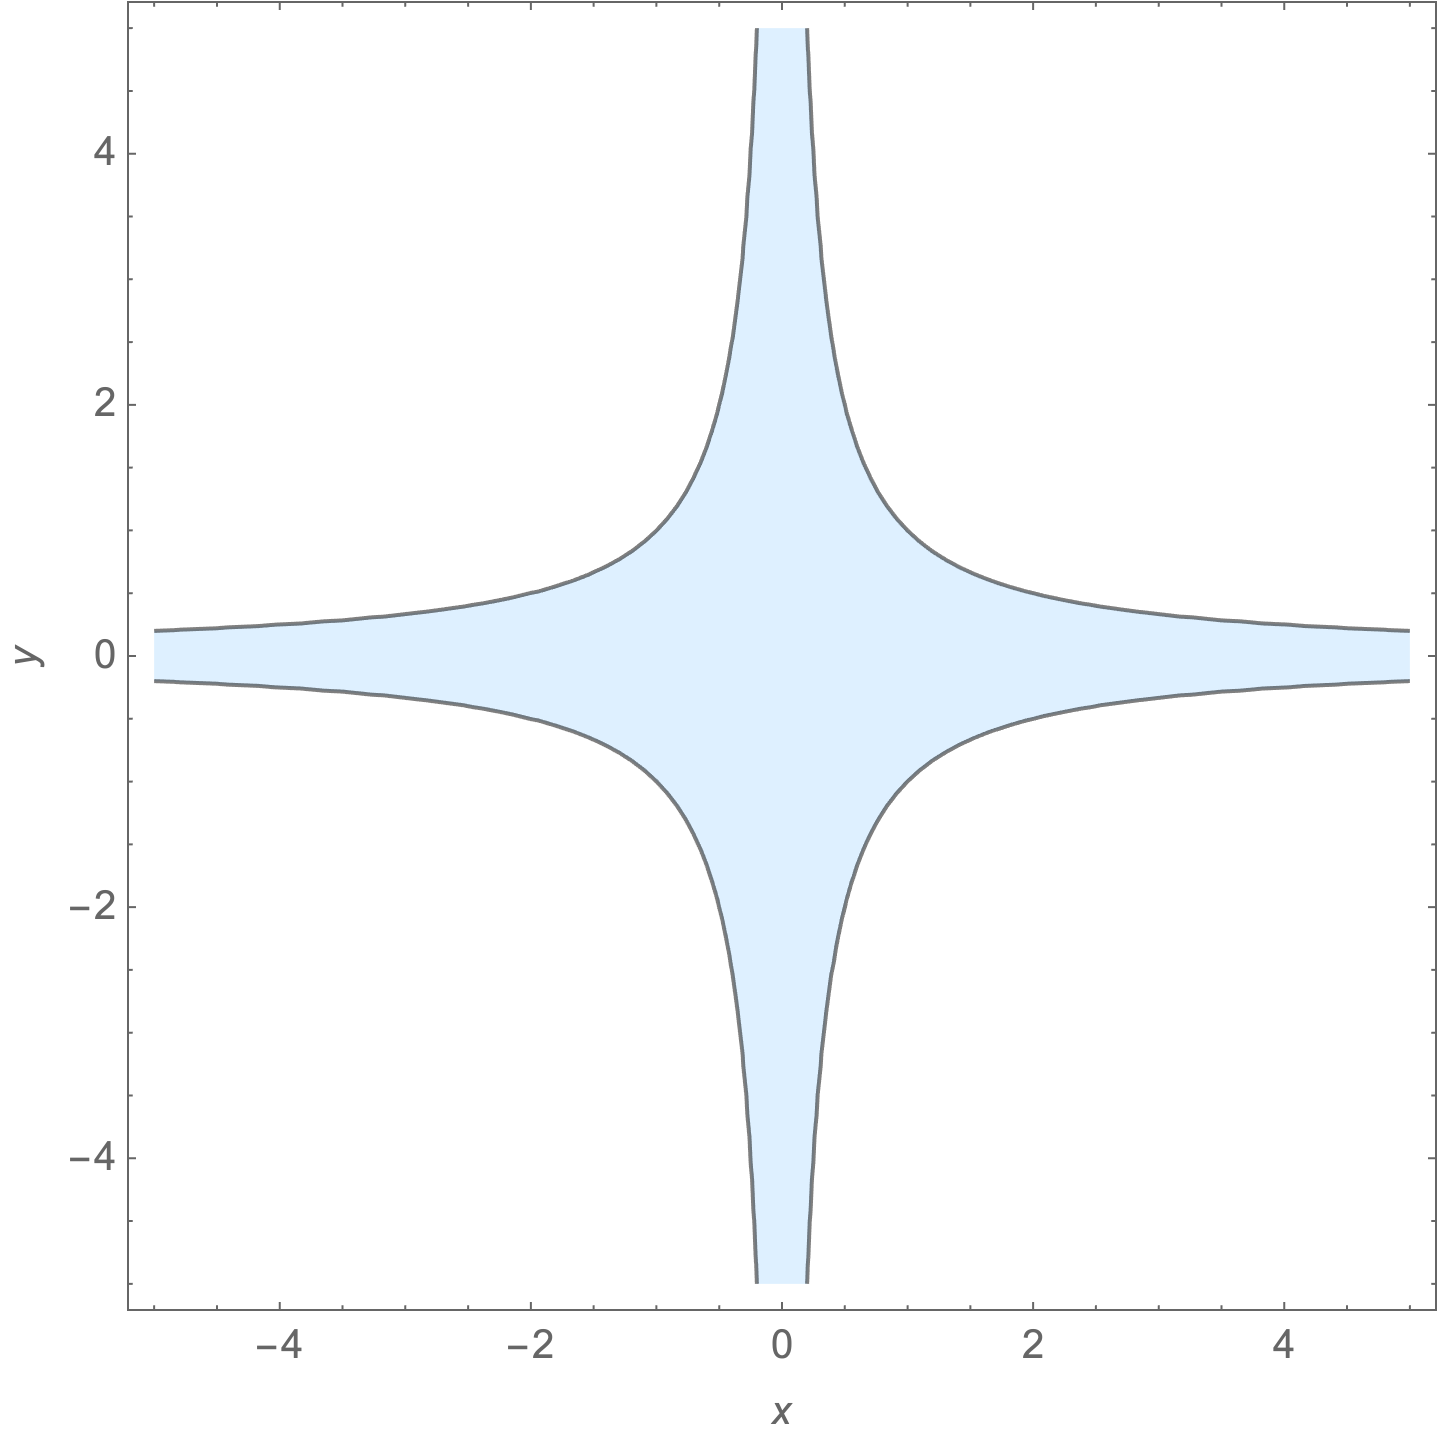
enter image description here

DensityPlot[f[x, y], {x, -5, 5}, {y, -5, 5},
 FrameLabel -> Automatic]
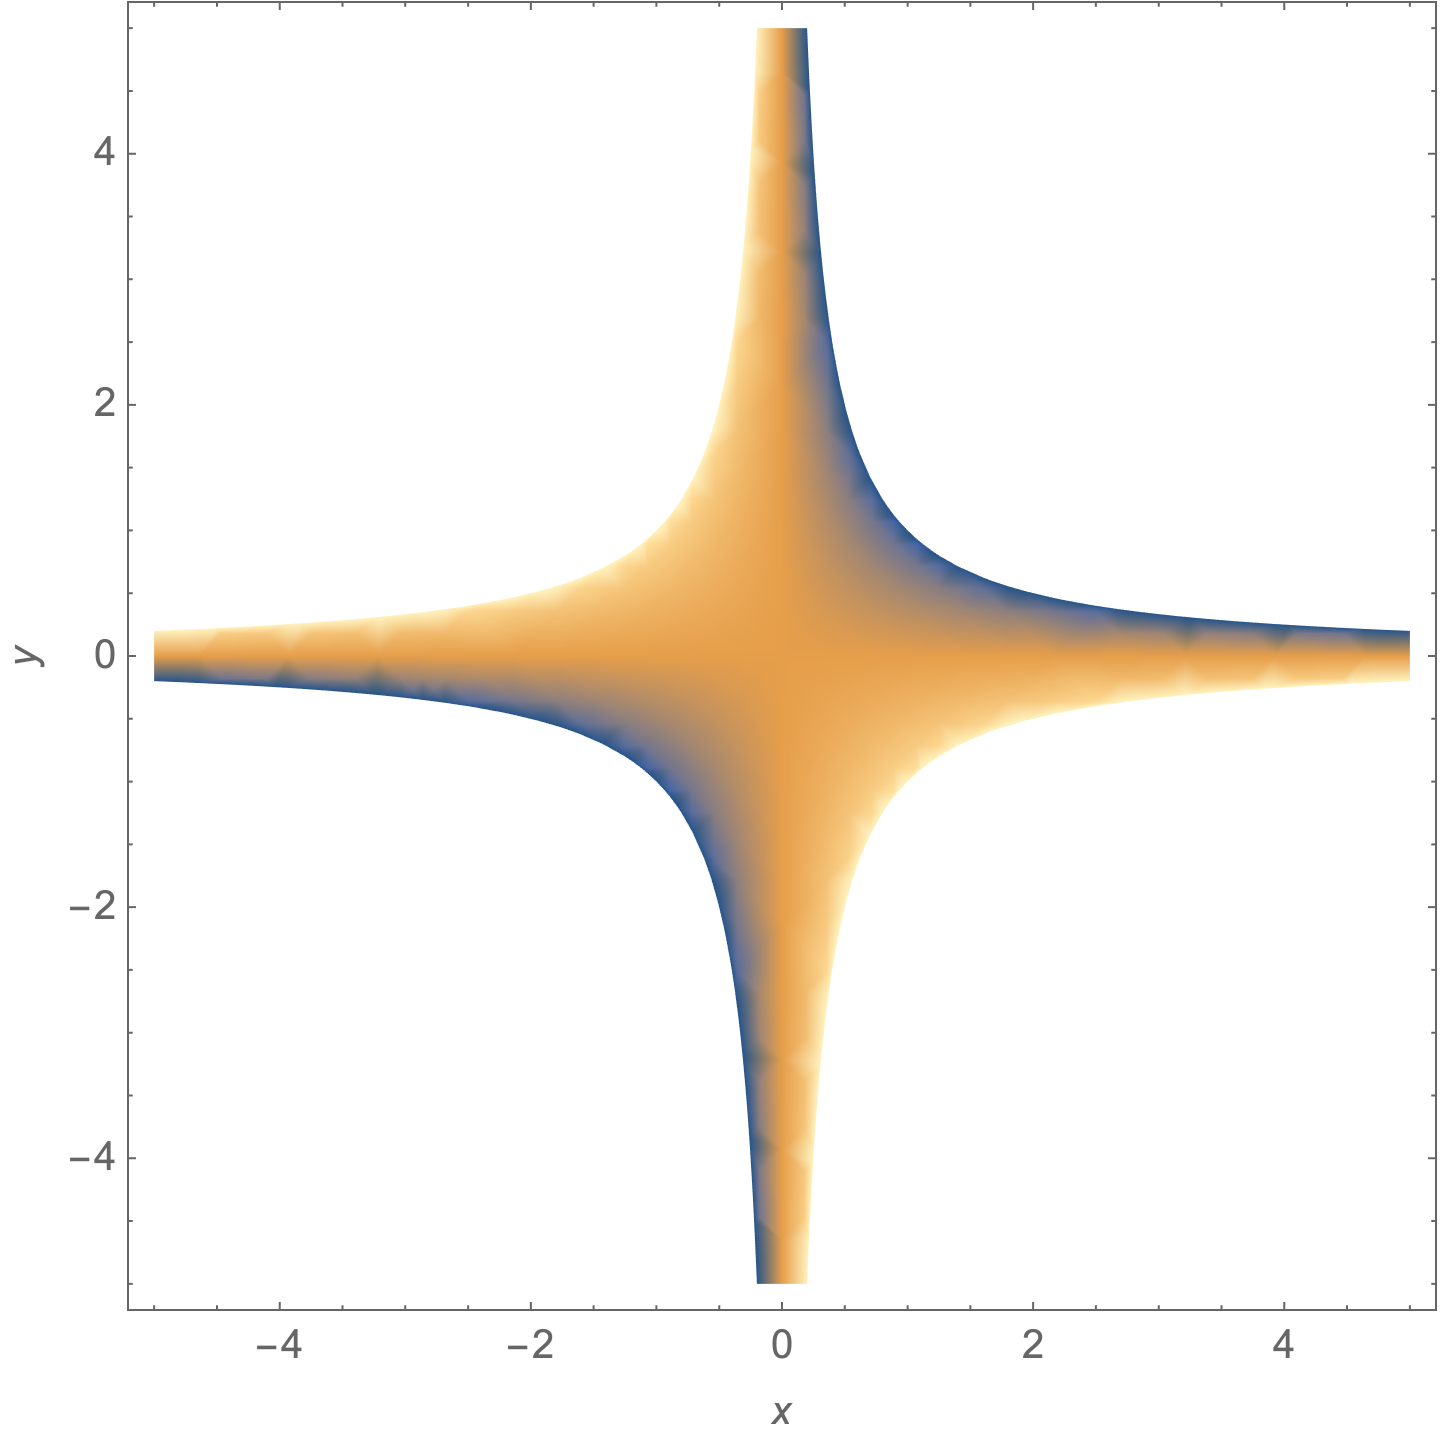
enter image description here

Added DensityPlot
Source Link
Bob Hanlon
  • 162.7k
  • 7
  • 81
  • 205
Clear["Global`*"]

f[x_, y_] = ArcCos[x*y];

fd = FunctionDomain[f[x, y], {x, y}, Reals]

(* -1 <= x y <= 1 *)

RegionPlot[fd, {x, -5, 5}, {y, -5, 5},
 PlotPoints -> 50,
 MaxRecursion -> 5,
 FrameLabel -> Automatic]

enter image description here

Plot3D[f[x, y], {x, -5, 5}, {y, -5, 5},
 ViewPoint -> Above,
 AxesLabel -> Automatic]

enter image description here

ContourPlot[x*y, {x, -5, 5}, {y, -5, 5},
 Contours -> {-1, 1},
 ContourShading -> {White, LightBlue},
 FrameLabel -> Automatic]

enter image description here

DensityPlot[f[x, y], {x, -5, 5}, {y, -5, 5},
 FrameLabel -> Automatic]

enter image description here

Clear["Global`*"]

f[x_, y_] = ArcCos[x*y];

fd = FunctionDomain[f[x, y], {x, y}, Reals]

(* -1 <= x y <= 1 *)

RegionPlot[fd, {x, -5, 5}, {y, -5, 5},
 PlotPoints -> 50,
 MaxRecursion -> 5,
 FrameLabel -> Automatic]

enter image description here

Plot3D[f[x, y], {x, -5, 5}, {y, -5, 5},
 ViewPoint -> Above,
 AxesLabel -> Automatic]

enter image description here

ContourPlot[x*y, {x, -5, 5}, {y, -5, 5},
 Contours -> {-1, 1},
 ContourShading -> {White, LightBlue},
 FrameLabel -> Automatic]

enter image description here

DensityPlot[f[x, y], {x, -5, 5}, {y, -5, 5},
 FrameLabel -> Automatic]

enter image description here

Added ContourPlot
Source Link
Bob Hanlon
  • 162.7k
  • 7
  • 81
  • 205
Clear["Global`*"]

f[x_, y_] = ArcCos[x*y];

fd = FunctionDomain[f[x, y], {x, y}, Reals]

(* -1 <= x y <= 1 *)

RegionPlot[fd, {x, -5, 5}, {y, -5, 5},
 PlotPoints -> 50,
 MaxRecursion -> 5,
 FrameLabel -> Automatic]

enter image description here

Plot3D[f[x, y], {x, -5, 5}, {y, -5, 5},
 ViewPoint -> Above,
 AxesLabel -> Automatic]

enter image description here

ContourPlot[x*y, {x, -5, 5}, {y, -5, 5},
 Contours -> {-1, 1},
 ContourShading -> {White, LightBlue},
 FrameLabel -> Automatic]

enter image description here

Clear["Global`*"]

f[x_, y_] = ArcCos[x*y];

fd = FunctionDomain[f[x, y], {x, y}, Reals]

(* -1 <= x y <= 1 *)

RegionPlot[fd, {x, -5, 5}, {y, -5, 5},
 PlotPoints -> 50,
 MaxRecursion -> 5,
 FrameLabel -> Automatic]

enter image description here

Plot3D[f[x, y], {x, -5, 5}, {y, -5, 5},
 ViewPoint -> Above,
 AxesLabel -> Automatic]

enter image description here

ContourPlot[x*y, {x, -5, 5}, {y, -5, 5},
 Contours -> {-1, 1},
 ContourShading -> {White, LightBlue},
 FrameLabel -> Automatic]

enter image description here

Source Link
Bob Hanlon
  • 162.7k
  • 7
  • 81
  • 205
Loading