lis[n_] := Refine[
   Table[i^4, {i, 0, 1, 1/n}], {Element[n, Reals], n > 0}];

$Assumptions = grad > 0 && Element[grad, Reals];

grad = {1, 1, 9, 9, 9, 9, 9, 9, 10, 10, 10};

int = Interpolation[grad];

$Assumptions = x > 0 && Element[x, Reals];

cf = Function[{x, f}, ColorData[{"AvocadoColors", {0, 10}}][int[x]]];

cf2 = ColorData[{"AvocadoColors", {0, 10}}] /@ grad;

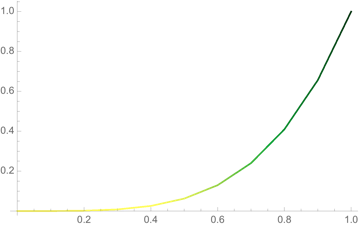
g1 = ListLinePlot[lis, ColorFunction -> cf,
  ColorFunctionScaling -> False]
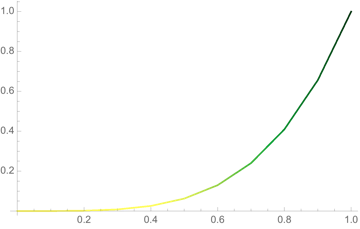
g2 = ListLinePlot[lis, ColorFunction -> cf,
  ColorFunctionScaling -> False]
g3 = ListLinePlot[Table[{i, i^4}, {i, 0, 1, 1/n}],
  ColorFunction -> cf,
     ColorFunctionScaling -> False]
Do you want g3 to be like this using cf !?g3 now varying colored


