Fixed (most) of the issues with Manipulate.
Source Link
JimB
  • 42.9k
  • 3
  • 51
  • 108
Manipulate[
 f1 = ((1 + (1 - p) β) ((-H r + Y)^(1 - 1/ϵ) + (H θ)^(1 - 1/ϵ))^((1 - 1/σ)/(1 - 1/ϵ)))/(1 - 1/σ) + (p β ((Y - H (r + α))^(1 - 1/ϵ) + (H θ)^(1 - 1/ϵ))^((1 - 1/σ)/(1 - 1/ϵ)))/(1 - 1/σ);
 f2 = (p β ((Y δ)^(1 - 1/ϵ) + 5000^(1 - 1/ϵ) θ^(1 - 1/ϵ))^((1 - 1/σ)/(1 - 1/ϵ)))/(1 - 1/σ) + ((1 + (1 - p) β) ((-H r + Y)^(1 - 1/ϵ) + (H θ)^(1 - 1/ϵ))^((1 - 1/σ)/(1 - 1/ϵ)))/(1 - 1/σ);
 sol1 = Maximize[{f1, H <= (Y - Y δ)/(r + α), 
    H > 0, (Y - r*H) ⩾ 0}, H];
 sol2 = Maximize[{f2, H > (Y - Y δ)/(r + α), 
    H > 0, (Y - r*H) ⩾ 0}, H]; 
 max = If[sol1[[1]] > sol2[[1]], sol1, sol2];
 hmin = 0.8 H /. sol1[[2]];
 hmax = 1.2 H /. sol2[[2]];
 {ymin, ymax} = 
  MinMax[{f1 /. H -> hmin, f1 /. H -> (Y - Y δ)/(r + α),
     f2 /. H -> (Y - Y δ)/(r + α), f2 /. H -> hmax}];
 y0 = ymin - 0.95 (ymax - ymin);
 y1 = ymax + 1.05 (ymax - ymin);
 Show[Plot[f1, {H, hmin, (Y - Y δ)/(r + α)}, PlotRange -> {{hmin, hmax}, {y0, y1}}],
  Plot[f2, {H, (Y - Y δ)/(r + α), hmax}, PlotRange -> {{hmin, hmax}, {y0, y1}}],
  ListPlot[{{{H /. max[[2]], max[[1]]}}, {{H /. sol1[[2]], sol1[[1]]}},
    {{H /. sol2[[2]], sol2[[1]]}}}, PlotStyle -> {{PointSize[0.03], Red}, Blue, Blue}]],
 {{Y, 1000}, 1, 1000, Appearance -> "Labeled"},
 {{α, 0.05}, 0.02, 1, Appearance -> "Labeled"},
 {{r, 0.05}, 0.01, 1, Appearance -> "Labeled"},
 {{δ, 0.3}, 0.01, 1, Appearance -> "Labeled"},
 {{β, 0.95}, 0, 1, Appearance -> "Labeled"},
 {{θ, 10}, 0, 100, Appearance -> "Labeled"},
 {{ϵ, 1.2}, 0, 100, Appearance -> "Labeled"},
 {{σ, 0.2}, 0, 1, Appearance -> "Labeled"},
 {{p, 0.51}, 0, 1, Appearance -> "Labeled"},
 TrackedSymbols :> {Y, β, θ, α, r, ϵ, σ, δ, p},
 Initialization :> (f1 = ((1 + (1 - p) β) ((-H r + Y)^(1 - 1/ϵ) + (H θ)^(1 - 1/ϵ))^((1 - 1/σ)/
   (1 - 1/ϵ)))/(1 - 1/σ) + (p β ((Y - H (r + α))^(1 - 1/ϵ) + 
   (H, θ)^(1 - 1/ϵ))^((1 - 1/σ)/(1 - 1/ϵ)))/(1 - 1/σ);
   f2 = (p β ((Y δ)^(1 - 1/ϵ) + 5000^(1 - 1/ϵ) θ^(1 - 1/ϵ))^((1 - 1/σ)/
     (1 - 1/ϵ)))/(1 -, 1/σ) + ((1 + (1 -, p) β) ((-H r + Y)^(1 - 1/ϵ) + 
     (H θ)^(1 - 1/ϵ))^((1 - 1/σ)/(1 - 1/ϵ)))/(1 - 1/σ))}]

Maxima of function partsMaxima for both parts of the function

Manipulate[
 sol1 = Maximize[{f1, H <= (Y - Y δ)/(r + α), 
    H > 0, (Y - r*H) ⩾ 0}, H];
 sol2 = Maximize[{f2, H > (Y - Y δ)/(r + α), 
    H > 0, (Y - r*H) ⩾ 0}, H];
 max = If[sol1[[1]] > sol2[[1]], sol1, sol2];
 hmin = 0.8 H /. sol1[[2]];
 hmax = 1.2 H /. sol2[[2]];
 {ymin, ymax} = 
  MinMax[{f1 /. H -> hmin, f1 /. H -> (Y - Y δ)/(r + α),
     f2 /. H -> (Y - Y δ)/(r + α), f2 /. H -> hmax}];
 y0 = ymin - 0.95 (ymax - ymin);
 y1 = ymax + 1.05 (ymax - ymin);
 Show[Plot[f1, {H, hmin, (Y - Y δ)/(r + α)}, PlotRange -> {{hmin, hmax}, {y0, y1}}],
  Plot[f2, {H, (Y - Y δ)/(r + α), hmax}, PlotRange -> {{hmin, hmax}, {y0, y1}}],
  ListPlot[{{{H /. max[[2]], max[[1]]}}, {{H /. sol1[[2]], sol1[[1]]}},
    {{H /. sol2[[2]], sol2[[1]]}}}, PlotStyle -> {{PointSize[0.03], Red}, Blue, Blue}]],
 {{Y, 1000}, 1, 1000, Appearance -> "Labeled"},
 {{α, 0.05}, 0.02, 1, Appearance -> "Labeled"},
 {{r, 0.05}, 0.01, 1, Appearance -> "Labeled"},
 {{δ, 0.3}, 0.01, 1, Appearance -> "Labeled"},
 {{β, 0.95}, 0, 1, Appearance -> "Labeled"},
 {{θ, 10}, 0, 100, Appearance -> "Labeled"},
 {{ϵ, 1.2}, 0, 100, Appearance -> "Labeled"},
 {{σ, 0.2}, 0, 1, Appearance -> "Labeled"},
 {{p, 0.51}, 0, 1, Appearance -> "Labeled"},
 TrackedSymbols :> {Y, β, θ, α, r, ϵ, σ, δ, p},
 Initialization :> (f1 = ((1 + (1 - p) β) ((-H r + Y)^(1 - 1/ϵ) + (H θ)^(1 - 1/ϵ))^((1 - 1/σ)/
   (1 - 1/ϵ)))/(1 - 1/σ) + (p β ((Y - H (r + α))^(1 - 1/ϵ) + 
   (H θ)^(1 - 1/ϵ))^((1 - 1/σ)/(1 - 1/ϵ)))/(1 - 1/σ);
   f2 = (p β ((Y δ)^(1 - 1/ϵ) + 5000^(1 - 1/ϵ) θ^(1 - 1/ϵ))^((1 - 1/σ)/
     (1 - 1/ϵ)))/(1 - 1/σ) + ((1 + (1 - p) β) ((-H r + Y)^(1 - 1/ϵ) + 
     (H θ)^(1 - 1/ϵ))^((1 - 1/σ)/(1 - 1/ϵ)))/(1 - 1/σ))]
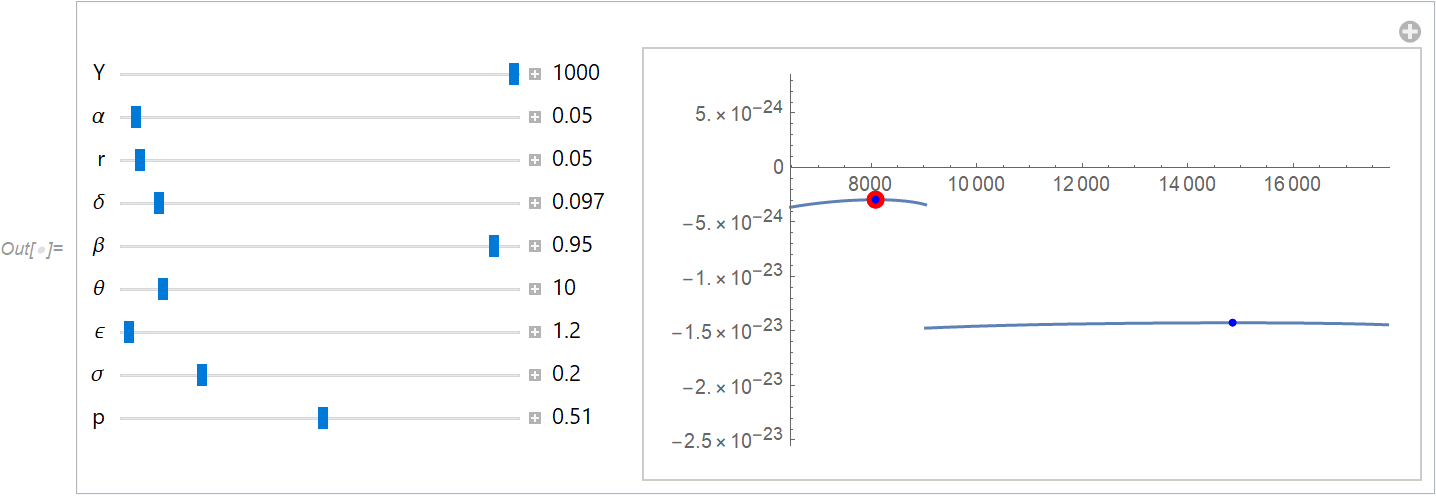
Maxima of function parts

Manipulate[
 f1 = ((1 + (1 - p) β) ((-H r + Y)^(1 - 1/ϵ) + (H θ)^(1 - 1/ϵ))^((1 - 1/σ)/(1 - 1/ϵ)))/(1 - 1/σ) + (p β ((Y - H (r + α))^(1 - 1/ϵ) + (H θ)^(1 - 1/ϵ))^((1 - 1/σ)/(1 - 1/ϵ)))/(1 - 1/σ);
 f2 = (p β ((Y δ)^(1 - 1/ϵ) + 5000^(1 - 1/ϵ) θ^(1 - 1/ϵ))^((1 - 1/σ)/(1 - 1/ϵ)))/(1 - 1/σ) + ((1 + (1 - p) β) ((-H r + Y)^(1 - 1/ϵ) + (H θ)^(1 - 1/ϵ))^((1 - 1/σ)/(1 - 1/ϵ)))/(1 - 1/σ);
 sol1 = Maximize[{f1, H <= (Y - Y δ)/(r + α), H > 0, (Y - r*H) ⩾ 0}, H];
 sol2 = Maximize[{f2, H > (Y - Y δ)/(r + α),  H > 0, (Y - r*H) ⩾ 0}, H]; 
 max = If[sol1[[1]] > sol2[[1]], sol1, sol2];
 hmin = 0.8 H /. sol1[[2]];
 hmax = 1.2 H /. sol2[[2]];
 {ymin, ymax} = 
  MinMax[{f1 /. H -> hmin, f1 /. H -> (Y - Y δ)/(r + α),
     f2 /. H -> (Y - Y δ)/(r + α), f2 /. H -> hmax}];
 y0 = ymin - 0.95 (ymax - ymin);
 y1 = ymax + 1.05 (ymax - ymin);
 Show[Plot[f1, {H, hmin, (Y - Y δ)/(r + α)}, PlotRange -> {{hmin, hmax}, {y0, y1}}],
  Plot[f2, {H, (Y - Y δ)/(r + α), hmax}, PlotRange -> {{hmin, hmax}, {y0, y1}}],
  ListPlot[{{{H /. max[[2]], max[[1]]}}, {{H /. sol1[[2]], sol1[[1]]}},
    {{H /. sol2[[2]], sol2[[1]]}}}, PlotStyle -> {{PointSize[0.03], Red}, Blue, Blue}]],
 {{Y, 1000}, 1, 1000, Appearance -> "Labeled"},
 {{α, 0.05}, 0.02, 1, Appearance -> "Labeled"},
 {{r, 0.05}, 0.01, 1, Appearance -> "Labeled"},
 {{δ, 0.3}, 0.01, 1, Appearance -> "Labeled"},
 {{β, 0.95}, 0, 1, Appearance -> "Labeled"},
 {{θ, 10}, 0, 100, Appearance -> "Labeled"},
 {{ϵ, 1.2}, 0, 100, Appearance -> "Labeled"},
 {{σ, 0.2}, 0, 1, Appearance -> "Labeled"},
 {{p, 0.51}, 0, 1, Appearance -> "Labeled"},
 TrackedSymbols :> {Y, α, r, δ, β, θ, σ, p}]

Maxima for both parts of the function

Changed "no effect" to "very little effect". Actually removed this sentence completely. Need to check on the code.
Source Link
JimB
  • 42.9k
  • 3
  • 51
  • 108

Note that it appears that $\beta$, $\theta$, $\epsilon$, $\sigma$, and $p$ have no effect on either part of the function.

Note that it appears that $\beta$, $\theta$, $\epsilon$, $\sigma$, and $p$ have no effect on either part of the function.
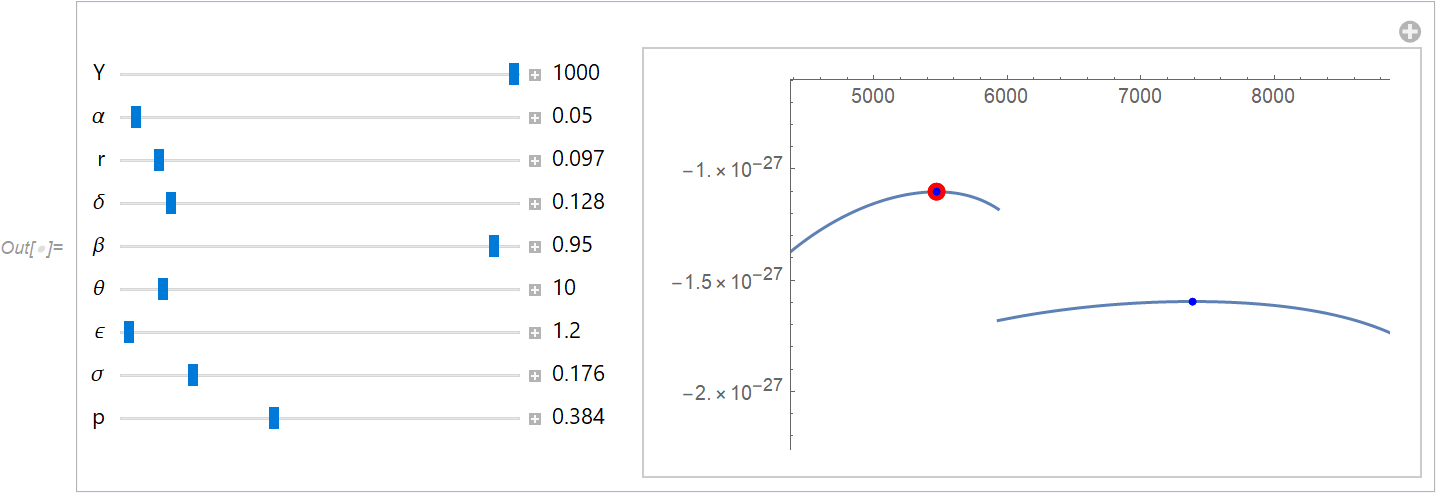
Added in Manipulate to show stability in the results.
Source Link
JimB
  • 42.9k
  • 3
  • 51
  • 108

As a check on varying parameter values consider some sort of a Manipulate:

Manipulate[
 sol1 = Maximize[{f1, H <= (Y - Y δ)/(r + α), 
    H > 0, (Y - r*H) ⩾ 0}, H];
 sol2 = Maximize[{f2, H > (Y - Y δ)/(r + α), 
    H > 0, (Y - r*H) ⩾ 0}, H];
 max = If[sol1[[1]] > sol2[[1]], sol1, sol2];
 hmin = 0.8 H /. sol1[[2]];
 hmax = 1.2 H /. sol2[[2]];
 {ymin, ymax} = 
  MinMax[{f1 /. H -> hmin, f1 /. H -> (Y - Y δ)/(r + α),
     f2 /. H -> (Y - Y δ)/(r + α), f2 /. H -> hmax}];
 y0 = ymin - 0.95 (ymax - ymin);
 y1 = ymax + 1.05 (ymax - ymin);
 Show[Plot[f1, {H, hmin, (Y - Y δ)/(r + α)}, PlotRange -> {{hmin, hmax}, {y0, y1}}],
  Plot[f2, {H, (Y - Y δ)/(r + α), hmax}, PlotRange -> {{hmin, hmax}, {y0, y1}}],
  ListPlot[{{{H /. max[[2]], max[[1]]}}, {{H /. sol1[[2]], sol1[[1]]}},
    {{H /. sol2[[2]], sol2[[1]]}}}, PlotStyle -> {{PointSize[0.03], Red}, Blue, Blue}]],
 {{Y, 1000}, 1, 1000, Appearance -> "Labeled"},
 {{α, 0.05}, 0.02, 1, Appearance -> "Labeled"},
 {{r, 0.05}, 0.01, 1, Appearance -> "Labeled"},
 {{δ, 0.3}, 0.01, 1, Appearance -> "Labeled"},
 {{β, 0.95}, 0, 1, Appearance -> "Labeled"},
 {{θ, 10}, 0, 100, Appearance -> "Labeled"},
 {{ϵ, 1.2}, 0, 100, Appearance -> "Labeled"},
 {{σ, 0.2}, 0, 1, Appearance -> "Labeled"},
 {{p, 0.51}, 0, 1, Appearance -> "Labeled"},
 TrackedSymbols :> {Y, β, θ, α, r, ϵ, σ, δ, p},
 Initialization :> (f1 = ((1 + (1 - p) β) ((-H r + Y)^(1 - 1/ϵ) + (H θ)^(1 - 1/ϵ))^((1 - 1/σ)/
   (1 - 1/ϵ)))/(1 - 1/σ) + (p β ((Y - H (r + α))^(1 - 1/ϵ) + 
   (H θ)^(1 - 1/ϵ))^((1 - 1/σ)/(1 - 1/ϵ)))/(1 - 1/σ);
   f2 = (p β ((Y δ)^(1 - 1/ϵ) + 5000^(1 - 1/ϵ) θ^(1 - 1/ϵ))^((1 - 1/σ)/
     (1 - 1/ϵ)))/(1 - 1/σ) + ((1 + (1 - p) β) ((-H r + Y)^(1 - 1/ϵ) + 
     (H θ)^(1 - 1/ϵ))^((1 - 1/σ)/(1 - 1/ϵ)))/(1 - 1/σ))]

Maxima of function parts

Note that it appears that $\beta$, $\theta$, $\epsilon$, $\sigma$, and $p$ have no effect on either part of the function.

Source Link
JimB
  • 42.9k
  • 3
  • 51
  • 108
Loading