added 131 characters in body
Source Link
user64494
  • 29.1k
  • 4
  • 29
  • 56

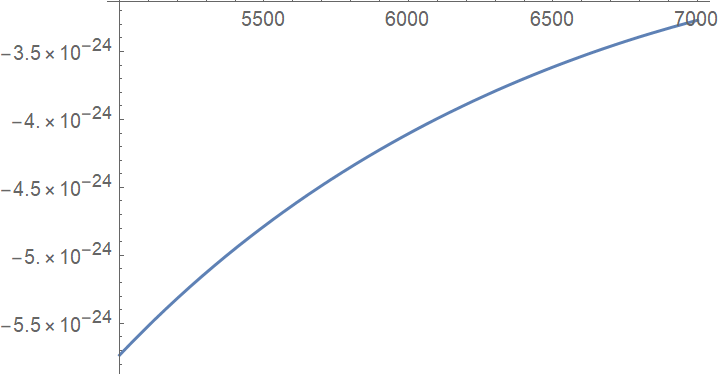
Let us build the plot

Plot[(1 + \[Beta]*(1 - 
    p))*(((Y - r*H)^(1 - 1/\[Epsilon]) + (\[Theta]*H)^(1 - 
       1/\[Epsilon]))^((1 - 1/\[Sigma])/(1 - 1/\[Epsilon])))/(1 - 
  1/\[Sigma]) + \[Beta]*p*   g1[H]*(((Y - (r + \[Alpha])*H)^(1 - 1/\[Epsilon]) + (\[Theta]*
       H)^(1 - 1/\[Epsilon]))^((1 - 1/\[Sigma])/(1 - 
      1/\[Epsilon])))/(1 - 1/\[Sigma]) + \[Beta]*p* h1[H]*(((\[Delta]*Y)^(1 - 1/\[Epsilon]) + (\[Theta]*5000)^(1 - 
       1/\[Epsilon]))^((1 - 1/\[Sigma])/(1 - 1/\[Epsilon])))/(1 - 
  1/\[Sigma]), {H, 5000, 7000}]

enter image description here

I think the question is closed.

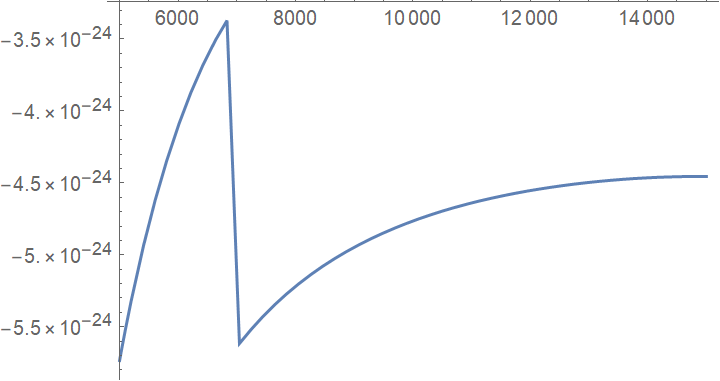
Addition. See the plot on {H,5000,15000} enter image description here
Let us build the plot

Plot[(1 + \[Beta]*(1 - 
    p))*(((Y - r*H)^(1 - 1/\[Epsilon]) + (\[Theta]*H)^(1 - 
       1/\[Epsilon]))^((1 - 1/\[Sigma])/(1 - 1/\[Epsilon])))/(1 - 
  1/\[Sigma]) + \[Beta]*p*   g1[H]*(((Y - (r + \[Alpha])*H)^(1 - 1/\[Epsilon]) + (\[Theta]*
       H)^(1 - 1/\[Epsilon]))^((1 - 1/\[Sigma])/(1 - 
      1/\[Epsilon])))/(1 - 1/\[Sigma]) + \[Beta]*p* h1[H]*(((\[Delta]*Y)^(1 - 1/\[Epsilon]) + (\[Theta]*5000)^(1 - 
       1/\[Epsilon]))^((1 - 1/\[Sigma])/(1 - 1/\[Epsilon])))/(1 - 
  1/\[Sigma]), {H, 5000, 7000}]

enter image description here

I think the question is closed.

Addition. See the plot on {H,5000,15000} enter image description here

Source Link
user64494
  • 29.1k
  • 4
  • 29
  • 56

Let us build the plot

Plot[(1 + \[Beta]*(1 - 
    p))*(((Y - r*H)^(1 - 1/\[Epsilon]) + (\[Theta]*H)^(1 - 
       1/\[Epsilon]))^((1 - 1/\[Sigma])/(1 - 1/\[Epsilon])))/(1 - 
  1/\[Sigma]) + \[Beta]*p*   g1[H]*(((Y - (r + \[Alpha])*H)^(1 - 1/\[Epsilon]) + (\[Theta]*
       H)^(1 - 1/\[Epsilon]))^((1 - 1/\[Sigma])/(1 - 
      1/\[Epsilon])))/(1 - 1/\[Sigma]) + \[Beta]*p* h1[H]*(((\[Delta]*Y)^(1 - 1/\[Epsilon]) + (\[Theta]*5000)^(1 - 
       1/\[Epsilon]))^((1 - 1/\[Sigma])/(1 - 1/\[Epsilon])))/(1 - 
  1/\[Sigma]), {H, 5000, 7000}]

enter image description here

I think the question is closed.