formatting
Source Link
Brett Champion
  • 20.9k
  • 2
  • 65
  • 122

You can certainly draw 2d2D fractals, eg the Mandelbrot set

ClearAll[mnd]
mnd = Compile[{{m, _Integer}, {n, _Integer}, {steps, _Integer}, \
{maxiter, _Integer}, {xmax, _Real}},
   Block[{z, c, iters = 0},
    z = c = -xmax + 2.*xmax*n/steps - 0.5 + 
       I*(-xmax + 2.*xmax*m/steps);
    While[(iters < maxiter) && (Abs@z < 2),
     iters++;
     z = z^2 + c
     ];
    Sqrt[iters/maxiter]
    ],
   {{z, _Complex}, {c, _Complex}}
   ];

ListContourPlot[
 Table[
  mnd[m, n, 200, 200, 1],
  {m, 1, 200}, {n, 1, 200}
  ],
 Frame \[Rule]-> False
 ]
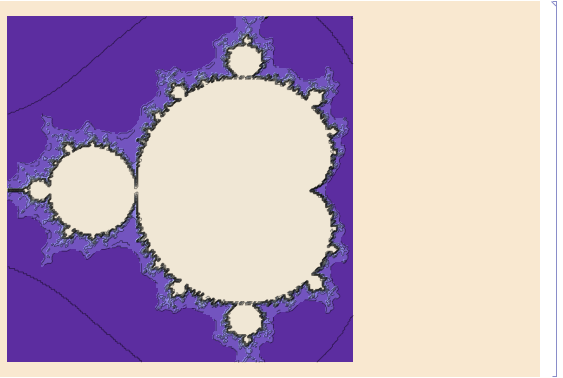
Mathematica graphics

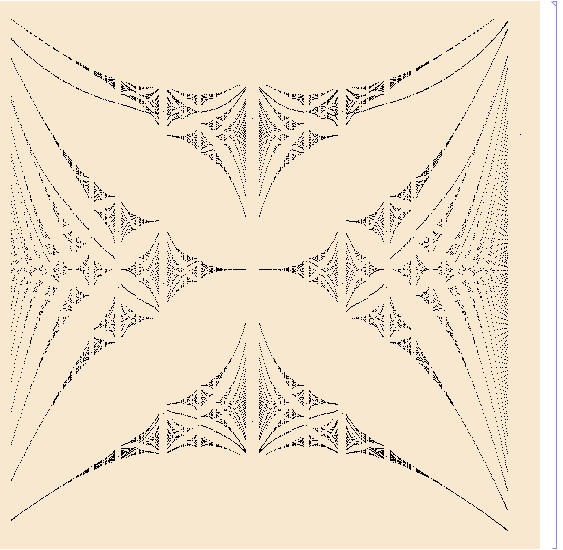
or the Hofstadter butterfly

ClearAll[matrix];
matrix[p_,q_,nu_:0]:=Module[
    {sigma},
    sigma=p/q;
    N@SparseArray[
        {{m_,m_}\[Rule]2Cos[2\[Pi]*m*p -> 2Cos[2Pi*m*p/q+nu]q + nu], {i_,j_}/;Abs[i-j]\[Equal]1\[Rule]1j] == 1 -> 1},{q,q}]]

ClearAll[attachsigma]
attachsigma[sigma_,lst_]:={sigma,#}&/@lst

fracs = Table[p/q, {q, 2, 80}, {p, 2, q}] // Flatten // 
   DeleteDuplicates;
pq = {Numerator@#, Denominator@#} & /@ fracs;
(ens = Eigenvalues[#] & /@ (matrix[#[[1]], #[[2]]] & /@ pq);) // Timing
pts = Flatten[#, 1] &@MapThread[attachsigma, {fracs, ens}];
plot = Graphics[
  {PointSize \[Rule] PointSize[0.001001], Point[pts]},
  AspectRatio \[Rule]-> 1,
  ImageSize \[Rule]-> Full
  ]
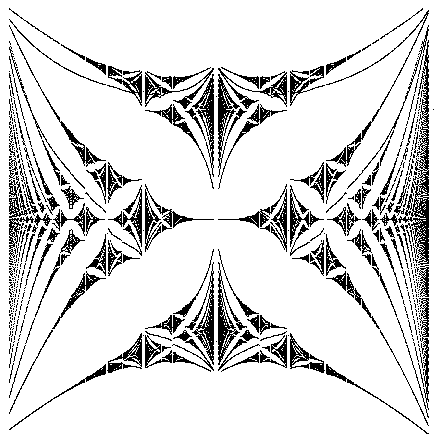
enter image description here

You can certainly draw 2d fractals, eg the Mandelbrot set

ClearAll[mnd]
mnd = Compile[{{m, _Integer}, {n, _Integer}, {steps, _Integer}, \
{maxiter, _Integer}, {xmax, _Real}},
   Block[{z, c, iters = 0},
    z = c = -xmax + 2.*xmax*n/steps - 0.5 + 
       I*(-xmax + 2.*xmax*m/steps);
    While[(iters < maxiter) && (Abs@z < 2),
     iters++;
     z = z^2 + c
     ];
    Sqrt[iters/maxiter]
    ],
   {{z, _Complex}, {c, _Complex}}
   ];

ListContourPlot[
 Table[
  mnd[m, n, 200, 200, 1],
  {m, 1, 200}, {n, 1, 200}
  ],
 Frame \[Rule] False
 ]

Mathematica graphics

or the Hofstadter butterfly

ClearAll[matrix];
matrix[p_,q_,nu_:0]:=Module[
    {sigma},
    sigma=p/q;
    N@SparseArray[
        {{m_,m_}\[Rule]2Cos[2\[Pi]*m*p/q+nu],{i_,j_}/;Abs[i-j]\[Equal]1\[Rule]1},{q,q}]]

ClearAll[attachsigma]
attachsigma[sigma_,lst_]:={sigma,#}&/@lst

fracs = Table[p/q, {q, 2, 80}, {p, 2, q}] // Flatten // 
   DeleteDuplicates;
pq = {Numerator@#, Denominator@#} & /@ fracs;
(ens = Eigenvalues[#] & /@ (matrix[#[[1]], #[[2]]] & /@ pq);) // Timing
pts = Flatten[#, 1] &@MapThread[attachsigma, {fracs, ens}];
plot = Graphics[
  {PointSize \[Rule] .001, Point[pts]},
  AspectRatio \[Rule] 1,
  ImageSize \[Rule] Full
  ]

enter image description here

You can certainly draw 2D fractals, eg the Mandelbrot set

ClearAll[mnd]
mnd = Compile[{{m, _Integer}, {n, _Integer}, {steps, _Integer},
{maxiter, _Integer}, {xmax, _Real}},
   Block[{z, c, iters = 0},
    z = c = -xmax + 2.*xmax*n/steps - 0.5 + I*(-xmax + 2.*xmax*m/steps);
    While[(iters < maxiter) && (Abs@z < 2),
     iters++;
     z = z^2 + c
     ];
    Sqrt[iters/maxiter]
    ],
   {{z, _Complex}, {c, _Complex}}
   ];

ListContourPlot[
 Table[
  mnd[m, n, 200, 200, 1],
  {m, 1, 200}, {n, 1, 200}
  ],
 Frame -> False
 ]

Mathematica graphics

or the Hofstadter butterfly

ClearAll[matrix];
matrix[p_,q_,nu_:0]:=Module[
    {sigma},
    sigma=p/q;
    N@SparseArray[
        {{m_,m_} -> 2Cos[2Pi*m*p/q + nu], {i_,j_}/;Abs[i-j] == 1 -> 1},{q,q}]]

ClearAll[attachsigma]
attachsigma[sigma_,lst_]:={sigma,#}&/@lst

fracs = Table[p/q, {q, 2, 80}, {p, 2, q}] // Flatten // 
   DeleteDuplicates;
pq = {Numerator@#, Denominator@#} & /@ fracs;
(ens = Eigenvalues[#] & /@ (matrix[#[[1]], #[[2]]] & /@ pq);) // Timing
pts = Flatten[#, 1] &@MapThread[attachsigma, {fracs, ens}];
plot = Graphics[
  {PointSize[0.001], Point[pts]},
  AspectRatio -> 1,
  ImageSize -> Full
  ]

enter image description here

added 22 characters in body
Source Link
acl
  • 19.9k
  • 3
  • 66
  • 94

You can certainly draw 2d fractals, eg the Mandelbrot set

ClearAll[mnd]
mnd = Compile[{{m, _Integer}, {n, _Integer}, {steps, _Integer}, \
{maxiter, _Integer}, {xmax, _Real}},
   Block[{z, c, iters = 0},
    z = c = -xmax + 2.*xmax*n/steps - 0.5 + 
       I*(-xmax + 2.*xmax*m/steps);
    While[(iters < maxiter) && (Abs@z < 2),
     iters++;
     z = z^2 + c
     ];
    Sqrt[iters/maxiter]
    ],
   {{z, _Complex}, {c, _Complex}}
   ];

ListContourPlot[
 Table[
  mnd[m, n, 200, 200, 1],
  {m, 1, 200}, {n, 1, 200}
  ],
 Frame \[Rule] False
 ]

Mathematica graphics

or the Hofstadter butterfly

ClearAll[matrix];
matrix[p_,q_,nu_:0]:=Module[
    {sigma},
    sigma=p/q;
    N@SparseArray[
        {{m_,m_}\[Rule]2Cos[2\[Pi]*m*p/q+nu],{i_,j_}/;Abs[i-j]\[Equal]1\[Rule]1},{q,q}]]

ClearAll[attachsigma]
attachsigma[sigma_,lst_]:={sigma,#}&/@lst

fracs = Table[p/q, {q, 2, 4080}, {p, 2, q}] // Flatten // 
   DeleteDuplicates;
pq = {Numerator@#, Denominator@#} & /@ fracs;
(ens = Eigenvalues[#] & /@ (matrix[#[[1]], #[[2]]] & /@ pq);) // Timing
pts = Flatten[#, 1] &@MapThread[attachsigma, {fracs, ens}];
plot = Graphics[
  {PointSize \[Rule] .001, Point[pts]},
  AspectRatio \[Rule] 1,
  ImageSize \[Rule] Full
  ]

Mathematica graphicsenter image description here

You can certainly draw 2d fractals, eg the Mandelbrot set

ClearAll[mnd]
mnd = Compile[{{m, _Integer}, {n, _Integer}, {steps, _Integer}, \
{maxiter, _Integer}, {xmax, _Real}},
   Block[{z, c, iters = 0},
    z = c = -xmax + 2.*xmax*n/steps - 0.5 + 
       I*(-xmax + 2.*xmax*m/steps);
    While[(iters < maxiter) && (Abs@z < 2),
     iters++;
     z = z^2 + c
     ];
    Sqrt[iters/maxiter]
    ],
   {{z, _Complex}, {c, _Complex}}
   ];

ListContourPlot[
 Table[
  mnd[m, n, 200, 200, 1],
  {m, 1, 200}, {n, 1, 200}
  ],
 Frame \[Rule] False
 ]

Mathematica graphics

or the Hofstadter butterfly

ClearAll[matrix];
matrix[p_,q_,nu_:0]:=Module[
    {sigma},
    sigma=p/q;
    N@SparseArray[
        {{m_,m_}\[Rule]2Cos[2\[Pi]*m*p/q+nu],{i_,j_}/;Abs[i-j]\[Equal]1\[Rule]1},{q,q}]]

ClearAll[attachsigma]
attachsigma[sigma_,lst_]:={sigma,#}&/@lst

fracs = Table[p/q, {q, 2, 40}, {p, 2, q}] // Flatten // 
   DeleteDuplicates;
pq = {Numerator@#, Denominator@#} & /@ fracs;
(ens = Eigenvalues[#] & /@ (matrix[#[[1]], #[[2]]] & /@ pq);) // Timing
pts = Flatten[#, 1] &@MapThread[attachsigma, {fracs, ens}];
plot = Graphics[
  {PointSize \[Rule] .001, Point[pts]},
  AspectRatio \[Rule] 1,
  ImageSize \[Rule] Full
  ]

Mathematica graphics

You can certainly draw 2d fractals, eg the Mandelbrot set

ClearAll[mnd]
mnd = Compile[{{m, _Integer}, {n, _Integer}, {steps, _Integer}, \
{maxiter, _Integer}, {xmax, _Real}},
   Block[{z, c, iters = 0},
    z = c = -xmax + 2.*xmax*n/steps - 0.5 + 
       I*(-xmax + 2.*xmax*m/steps);
    While[(iters < maxiter) && (Abs@z < 2),
     iters++;
     z = z^2 + c
     ];
    Sqrt[iters/maxiter]
    ],
   {{z, _Complex}, {c, _Complex}}
   ];

ListContourPlot[
 Table[
  mnd[m, n, 200, 200, 1],
  {m, 1, 200}, {n, 1, 200}
  ],
 Frame \[Rule] False
 ]

Mathematica graphics

or the Hofstadter butterfly

ClearAll[matrix];
matrix[p_,q_,nu_:0]:=Module[
    {sigma},
    sigma=p/q;
    N@SparseArray[
        {{m_,m_}\[Rule]2Cos[2\[Pi]*m*p/q+nu],{i_,j_}/;Abs[i-j]\[Equal]1\[Rule]1},{q,q}]]

ClearAll[attachsigma]
attachsigma[sigma_,lst_]:={sigma,#}&/@lst

fracs = Table[p/q, {q, 2, 80}, {p, 2, q}] // Flatten // 
   DeleteDuplicates;
pq = {Numerator@#, Denominator@#} & /@ fracs;
(ens = Eigenvalues[#] & /@ (matrix[#[[1]], #[[2]]] & /@ pq);) // Timing
pts = Flatten[#, 1] &@MapThread[attachsigma, {fracs, ens}];
plot = Graphics[
  {PointSize \[Rule] .001, Point[pts]},
  AspectRatio \[Rule] 1,
  ImageSize \[Rule] Full
  ]

enter image description here

Source Link
acl
  • 19.9k
  • 3
  • 66
  • 94

You can certainly draw 2d fractals, eg the Mandelbrot set

ClearAll[mnd]
mnd = Compile[{{m, _Integer}, {n, _Integer}, {steps, _Integer}, \
{maxiter, _Integer}, {xmax, _Real}},
   Block[{z, c, iters = 0},
    z = c = -xmax + 2.*xmax*n/steps - 0.5 + 
       I*(-xmax + 2.*xmax*m/steps);
    While[(iters < maxiter) && (Abs@z < 2),
     iters++;
     z = z^2 + c
     ];
    Sqrt[iters/maxiter]
    ],
   {{z, _Complex}, {c, _Complex}}
   ];

ListContourPlot[
 Table[
  mnd[m, n, 200, 200, 1],
  {m, 1, 200}, {n, 1, 200}
  ],
 Frame \[Rule] False
 ]

Mathematica graphics

or the Hofstadter butterfly

ClearAll[matrix];
matrix[p_,q_,nu_:0]:=Module[
    {sigma},
    sigma=p/q;
    N@SparseArray[
        {{m_,m_}\[Rule]2Cos[2\[Pi]*m*p/q+nu],{i_,j_}/;Abs[i-j]\[Equal]1\[Rule]1},{q,q}]]

ClearAll[attachsigma]
attachsigma[sigma_,lst_]:={sigma,#}&/@lst

fracs = Table[p/q, {q, 2, 40}, {p, 2, q}] // Flatten // 
   DeleteDuplicates;
pq = {Numerator@#, Denominator@#} & /@ fracs;
(ens = Eigenvalues[#] & /@ (matrix[#[[1]], #[[2]]] & /@ pq);) // Timing
pts = Flatten[#, 1] &@MapThread[attachsigma, {fracs, ens}];
plot = Graphics[
  {PointSize \[Rule] .001, Point[pts]},
  AspectRatio \[Rule] 1,
  ImageSize \[Rule] Full
  ]

Mathematica graphics