I'm trying to teach myself about sampling and filtering ---— and I'm not sure if I'm misunderstanding the concepts or misapplying the mmaWolfram Language. I started by creating a simple test signal with contributions at 2 and 3 Hz,
f[t_] := Sin[6 Pi t] + Cos[4 Pi t]
I then created a data set of sampled points
\[Tau]τ = 1/6.5;
freq = Table[n, {n, -15, 15, \[Tau]τ}];
data = Table[f[n], {n, -15, 15, \[Tau]τ}];
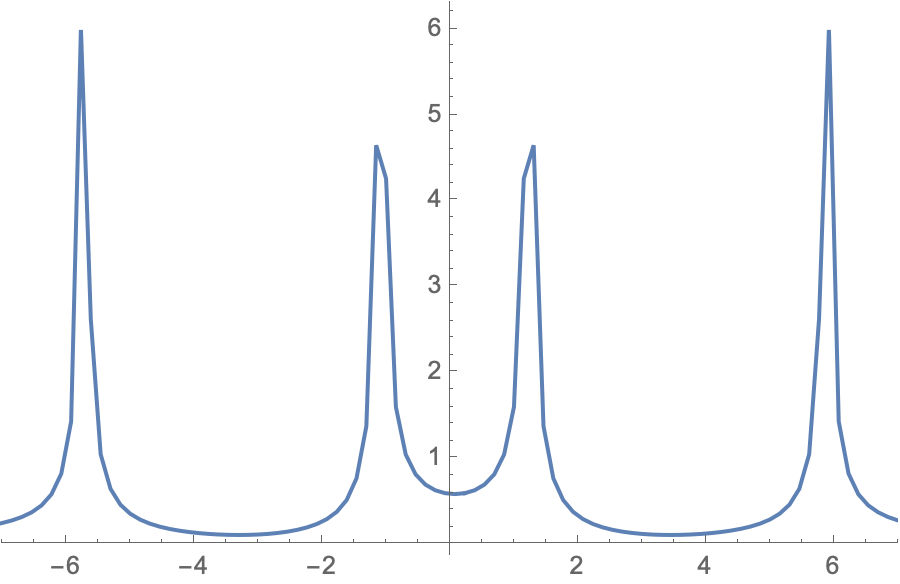
Plotting the FTFourier transform
combine = Partition[Riffle[freq, Abs[Fourier[data]]],2];
ListLinePlot[combine, PlotRange -> {{-7, 7}, All}]
gives
which is not peakedpeaking at either 3 or 2 Hz. Furthermore, when I plot
filtered = LowpassFilter[Abs[Fourier[data]], 2.5*Pi]
no discernible filtering occurs. Please --, what am I doing wrong?
TIA!

