deleted 34 characters in body
Source Link
Ulrich Neumann
  • 56.8k
  • 2
  • 26
  • 60

To get the datapoints of the solution try

sol = Module[{m = 1, b = 1, g = 9.8, k = 100, time = 5}, 
NDSolveValue[{m g Cos[\[Phi][t]] - k (l[t] - b) ==m (l''[t] - l[t] \[Phi]'[t]^2), -g Sin[\[Phi][t]] ==l[t] \[Phi]''[t] + 2 l'[t] \[Phi]'[t], l[0] == 1.2,l'[0] == 0, \[Phi][0] == 30*\[Pi]/180, \[Phi]'[0] == 0}, {l, \[Phi]}, {t, 0, time}]
]

solcontains two interpolation objects. The datapoints of the first solution are

data1=Transpose[{sol[[1]]["Coordinates"][[1]], sol[[1]]["ValuesOnGrid"]}];
Show[Plot[sol[[1]][t], {t, 0, 5}], ListPlot[data1, PlotStyle -> Red]]

enter image description herettps://i.sstatic.net/L4Shl.pngenter image description here

To get the datapoints of the solution try

sol = Module[{m = 1, b = 1, g = 9.8, k = 100, time = 5}, 
NDSolveValue[{m g Cos[\[Phi][t]] - k (l[t] - b) ==m (l''[t] - l[t] \[Phi]'[t]^2), -g Sin[\[Phi][t]] ==l[t] \[Phi]''[t] + 2 l'[t] \[Phi]'[t], l[0] == 1.2,l'[0] == 0, \[Phi][0] == 30*\[Pi]/180, \[Phi]'[0] == 0}, {l, \[Phi]}, {t, 0, time}]
]

solcontains two interpolation objects. The datapoints of the first solution are

data1=Transpose[{sol[[1]]["Coordinates"][[1]], sol[[1]]["ValuesOnGrid"]}];
Show[Plot[sol[[1]][t], {t, 0, 5}], ListPlot[data1, PlotStyle -> Red]]
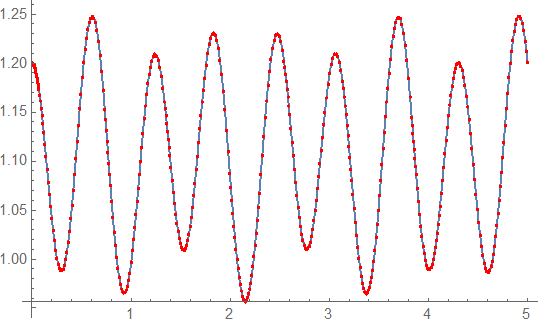
enter image description herettps://i.sstatic.net/L4Shl.png

To get the datapoints of the solution try

sol = Module[{m = 1, b = 1, g = 9.8, k = 100, time = 5}, 
NDSolveValue[{m g Cos[\[Phi][t]] - k (l[t] - b) ==m (l''[t] - l[t] \[Phi]'[t]^2), -g Sin[\[Phi][t]] ==l[t] \[Phi]''[t] + 2 l'[t] \[Phi]'[t], l[0] == 1.2,l'[0] == 0, \[Phi][0] == 30*\[Pi]/180, \[Phi]'[0] == 0}, {l, \[Phi]}, {t, 0, time}]
]

solcontains two interpolation objects. The datapoints of the first solution are

data1=Transpose[{sol[[1]]["Coordinates"][[1]], sol[[1]]["ValuesOnGrid"]}];
Show[Plot[sol[[1]][t], {t, 0, 5}], ListPlot[data1, PlotStyle -> Red]]

enter image description here

Source Link
Ulrich Neumann
  • 56.8k
  • 2
  • 26
  • 60

To get the datapoints of the solution try

sol = Module[{m = 1, b = 1, g = 9.8, k = 100, time = 5}, 
NDSolveValue[{m g Cos[\[Phi][t]] - k (l[t] - b) ==m (l''[t] - l[t] \[Phi]'[t]^2), -g Sin[\[Phi][t]] ==l[t] \[Phi]''[t] + 2 l'[t] \[Phi]'[t], l[0] == 1.2,l'[0] == 0, \[Phi][0] == 30*\[Pi]/180, \[Phi]'[0] == 0}, {l, \[Phi]}, {t, 0, time}]
]

solcontains two interpolation objects. The datapoints of the first solution are

data1=Transpose[{sol[[1]]["Coordinates"][[1]], sol[[1]]["ValuesOnGrid"]}];
Show[Plot[sol[[1]][t], {t, 0, 5}], ListPlot[data1, PlotStyle -> Red]]

enter image description herettps://i.sstatic.net/L4Shl.png