refine the code
Source Link
AsukaMinato
  • 10.4k
  • 1
  • 17
  • 44

So I am solving a differential equation using NDSolve and plotting the results. But I want to extract the data points in the produced plots to a .txt file. I am aware of the method to extract data from a regular plot of a function, but can't seem to figure out for the NDSolve. If this is not the way to do it, what other methods are available?

Module[{m = 1, b = 1, g = 9.8, k = 100, time = 5},
 s = NDSolve[{m g Cos[\[Phi][t]]Cos[ϕ[t]] - k (l[t] - b) == 
     m (l''[t] - l[t] \[Phi]'[t]^2ϕ'[t]^2),
    -g Sin[\[Phi][t]]Sin[ϕ[t]] == l[t] \[Phi]''[t]ϕ''[t] + 2 l'[t] \[Phi]'[t]ϕ'[t], 
    l[0] == 1.2, 
    l'[0] == 0, \[Phi][0]ϕ[0] == 30*\[Pi]30*π/180, \[Phi]'[0]ϕ'[0] == 0},
   {l, \[Phi]ϕ}, {t, 0, time}];
 Print[
  Plot[Evaluate[l[t] /. s], {t, 0, time}, AxesLabel -> {"t", "l"}, 
   ImageSize -> Small]];
 Print[
  Plot[Evaluate[\[Phi][t]Plot[Evaluate[ϕ[t] /. s], {t, 0, time}, 
   AxesLabel -> {"t", "\[Phi]""ϕ"}, ImageSize -> Small]];
 (*data = Cases[Plot[Evaluate[l[t]/.s],{t,0,time},Line[data_]:> data, \
-4*)
 Animate[
  Graphics[{Point[{0, 0}], 
     Point[{l[t] Sin[\[Phi][t]]Sin[ϕ[t]], -l[t] Cos[\[Phi][t]]Cos[ϕ[t]]}],
     Line[{{0, 0}, {l[t] Sin[\[Phi][t]]Sin[ϕ[t]], -l[t] Cos[\[Phi][t]]Cos[ϕ[t]]}}]} /. s,
   PlotRange -> {{-2 b, 2 b}, {-2 b, 0.1}}], {t, 0, time}]
 ]

enter image description here

So I am solving a differential equation using NDSolve and plotting the results. But I want to extract the data points in the produced plots to a .txt file. I am aware of the method to extract data from a regular plot of a function, but can't seem to figure out for the NDSolve. If this is not the way to do it, what other methods are available?

Module[{m = 1, b = 1, g = 9.8, k = 100, time = 5},
 s = NDSolve[{m g Cos[\[Phi][t]] - k (l[t] - b) == 
     m (l''[t] - l[t] \[Phi]'[t]^2),
    -g Sin[\[Phi][t]] == l[t] \[Phi]''[t] + 2 l'[t] \[Phi]'[t], 
    l[0] == 1.2, 
    l'[0] == 0, \[Phi][0] == 30*\[Pi]/180, \[Phi]'[0] == 0},
   {l, \[Phi]}, {t, 0, time}];
 Print[
  Plot[Evaluate[l[t] /. s], {t, 0, time}, AxesLabel -> {"t", "l"}, 
   ImageSize -> Small]];
 Print[
  Plot[Evaluate[\[Phi][t] /. s], {t, 0, time}, 
   AxesLabel -> {"t", "\[Phi]"}, ImageSize -> Small]];
 (*data = Cases[Plot[Evaluate[l[t]/.s],{t,0,time},Line[data_]:> data, \
-4*)
 Animate[
  Graphics[{Point[{0, 0}], 
     Point[{l[t] Sin[\[Phi][t]], -l[t] Cos[\[Phi][t]]}],
     Line[{{0, 0}, {l[t] Sin[\[Phi][t]], -l[t] Cos[\[Phi][t]]}}]} /. s,
   PlotRange -> {{-2 b, 2 b}, {-2 b, 0.1}}], {t, 0, time}]
 ]
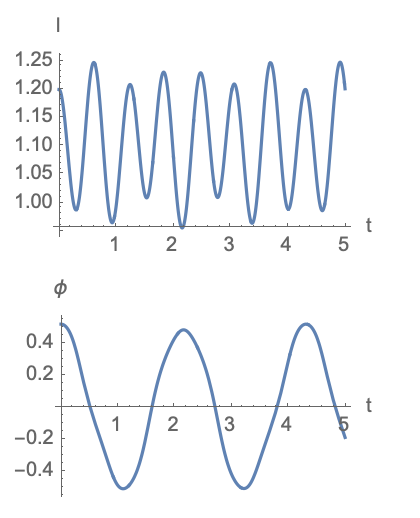
enter image description here

So I am solving a differential equation using NDSolve and plotting the results. But I want to extract the data points in the produced plots to a .txt file. I am aware of the method to extract data from a regular plot of a function, but can't seem to figure out for the NDSolve. If this is not the way to do it, what other methods are available?

Module[{m = 1, b = 1, g = 9.8, k = 100, time = 5},
 s = NDSolve[{m g Cos[ϕ[t]] - k (l[t] - b) == 
     m (l''[t] - l[t] ϕ'[t]^2),
    -g Sin[ϕ[t]] == l[t] ϕ''[t] + 2 l'[t] ϕ'[t], 
    l[0] == 1.2, 
    l'[0] == 0, ϕ[0] == 30*π/180, ϕ'[0] == 0},
   {l, ϕ}, {t, 0, time}];
 Print[
  Plot[Evaluate[l[t] /. s], {t, 0, time}, AxesLabel -> {"t", "l"}, 
   ImageSize -> Small]];
 Print[
  Plot[Evaluate[ϕ[t] /. s], {t, 0, time}, 
   AxesLabel -> {"t", "ϕ"}, ImageSize -> Small]];
 (*data = Cases[Plot[Evaluate[l[t]/.s],{t,0,time},Line[data_]:> data, \
-4*)
 Animate[
  Graphics[{Point[{0, 0}], 
     Point[{l[t] Sin[ϕ[t]], -l[t] Cos[ϕ[t]]}],
     Line[{{0, 0}, {l[t] Sin[ϕ[t]], -l[t] Cos[ϕ[t]]}}]} /. s,
   PlotRange -> {{-2 b, 2 b}, {-2 b, 0.1}}], {t, 0, time}]
 ]

enter image description here

Source Link

Extracting and plotting NDSolve expressions

So I am solving a differential equation using NDSolve and plotting the results. But I want to extract the data points in the produced plots to a .txt file. I am aware of the method to extract data from a regular plot of a function, but can't seem to figure out for the NDSolve. If this is not the way to do it, what other methods are available?

Module[{m = 1, b = 1, g = 9.8, k = 100, time = 5},
 s = NDSolve[{m g Cos[\[Phi][t]] - k (l[t] - b) == 
     m (l''[t] - l[t] \[Phi]'[t]^2),
    -g Sin[\[Phi][t]] == l[t] \[Phi]''[t] + 2 l'[t] \[Phi]'[t], 
    l[0] == 1.2, 
    l'[0] == 0, \[Phi][0] == 30*\[Pi]/180, \[Phi]'[0] == 0},
   {l, \[Phi]}, {t, 0, time}];
 Print[
  Plot[Evaluate[l[t] /. s], {t, 0, time}, AxesLabel -> {"t", "l"}, 
   ImageSize -> Small]];
 Print[
  Plot[Evaluate[\[Phi][t] /. s], {t, 0, time}, 
   AxesLabel -> {"t", "\[Phi]"}, ImageSize -> Small]];
 (*data = Cases[Plot[Evaluate[l[t]/.s],{t,0,time},Line[data_]:> data, \
-4*)
 Animate[
  Graphics[{Point[{0, 0}], 
     Point[{l[t] Sin[\[Phi][t]], -l[t] Cos[\[Phi][t]]}],
     Line[{{0, 0}, {l[t] Sin[\[Phi][t]], -l[t] Cos[\[Phi][t]]}}]} /. s,
   PlotRange -> {{-2 b, 2 b}, {-2 b, 0.1}}], {t, 0, time}]
 ]

enter image description here