Tweeted twitter.com/#!/StackMma/status/173558429896552448
deleted 37 characters in body; edited title
Source Link
rm -rf
  • 89.3k
  • 21
  • 297
  • 479

Histograms and overlapped Creating overlapping histogram plots

I am plotting two histograms on the same graph:

g1 = Histogram[bc, ChartStyle -> {Red}]
g2 = Histogram[bcx]
Show[g1, g2, PlotRange -> {{0.1, 0.6}, All}]
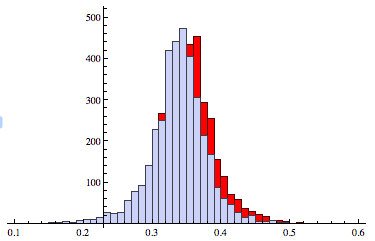
enter image description here

But iI would like the plots to overlappedoverlap so that they are "see-through" and iI can compare them. I've been trying with

ChartStyle -> {"Overlapped"}

which hasn't been working. Thank you for your help!

Histograms and overlapped plots

I am plotting two histograms on the same graph:

g1 = Histogram[bc, ChartStyle -> {Red}]
g2 = Histogram[bcx]
Show[g1, g2, PlotRange -> {{0.1, 0.6}, All}]

enter image description here

But i would like the plots to overlapped so that they are "see-through" and i can compare them. I've been trying with

ChartStyle -> {"Overlapped"}

which hasn't been working. Thank you for your help!

Creating overlapping histogram plots

I am plotting two histograms on the same graph:

g1 = Histogram[bc, ChartStyle -> {Red}]
g2 = Histogram[bcx]
Show[g1, g2, PlotRange -> {{0.1, 0.6}, All}]

enter image description here

But I would like the plots to overlap so that they are "see-through" and I can compare them. I've been trying with

ChartStyle -> {"Overlapped"}

which hasn't been working.

Source Link
Julia
  • 941
  • 2
  • 8
  • 9

Histograms and overlapped plots

I am plotting two histograms on the same graph:

g1 = Histogram[bc, ChartStyle -> {Red}]
g2 = Histogram[bcx]
Show[g1, g2, PlotRange -> {{0.1, 0.6}, All}]

enter image description here

But i would like the plots to overlapped so that they are "see-through" and i can compare them. I've been trying with

ChartStyle -> {"Overlapped"}

which hasn't been working. Thank you for your help!