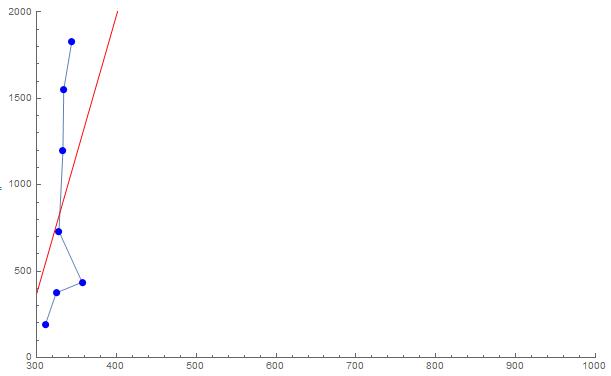
I have some data like:
data = Uncompress[FromCharacterCode[
  Flatten[ImageData[Import["https://i.sstatic.net/1E5DB.png"], "Byte"]]]]
If we use FindAnomalies then we can find aan outlier:
abponts = FindAnomalies[data]
{{357., 436.5}}
But I don't want to use FindAnomalies to do this, because it is too slow and I don't know how to use other languages to imitate such a neural network function.
The current idea is to fit a line for all points, then calculate the distance from the point to the fitting line. But it seems this distancelike the outlier in data is hard to distinguish thatas an outlier. The red line is the fitting line in follow:
Show[ListLinePlot[SortBy[data, Last],
  PlotRange -> {{300, 1000}, {0, 2000}}],
 Plot[Evaluate[Fit[data, {1, x}, x]], {x, 300, 1000},
  PlotStyle -> Red], ListPlot[data, PlotStyle -> Blue]]
Could anybody can give me some advice?

