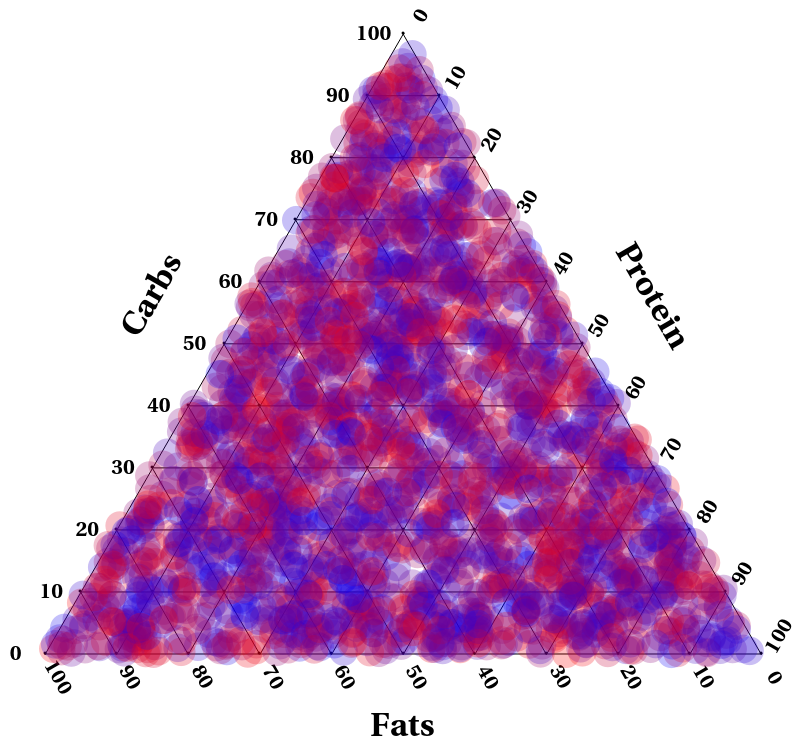
I'll start by making a random dataset. Here we take 2 random numbers for the first two variables then set the third such that $a+b+c=1$ to be consistent with a Ternary plot. Here $a,b,c$ correspond to carbs, fat, protein respectively. We take the 4th variable to be another independent random number which corresponds to sleep for your case. Lastly we select only the data where $\{a,b,c\}>0$
data = Select[Table[
{a, b, 1 - a - b, RandomReal[]} /. {a -> RandomReal[], b -> RandomReal[]}, {i, 5000}],
 # == Abs[#] &];
We'll want to define our transformation from 3 variables down into our triangular 2D grid and convert our data over. This I just pull directly from Wikipedia.
toGrid[p_] := 1/2 {2 p[[2]] + p[[3]], Sqrt[3] p[[3]]};
dataPts = {10 toGrid[Most@#], Last@#} & /@ data;
Next we'll define some quantities to draw our triangular grid with
pts3D = Select[Tuples[Range[0, 10], {3}], #[[1]] + #[[2]] + #[[3]] == 10 &];
pts = toGrid /@ pts3D;
ptsG = Table[toGrid /@ Select[pts3D, #[[i]] == 0 &], {i, 3}];
lines = {Thread[{ptsG[[1]], ptsG[[2]]}],
   Thread[{ptsG[[2]], ptsG[[3]]}],
   Thread[{ptsG[[1]], Reverse[ptsG[[3]]]}]};
Add some styling and text to spruce it up
st[sz_] := Style[#, Black, Bold, FontFamily -> "Times", sz] &;
rot = 60 Degree;
ticks = st[12] /@ Table[10 i, {i, 0, 10}];
labels = {Rotate[Text[st[16]["Carbs"], {1.5, 5}], rot],
   Text[st[16]["Fats"], {5, -1}],
   Rotate[Text[st[16]["Protein"], {8.5, 5}], -rot]};
mkTicks[ind_, ang_, off_] := Table[
Rotate[Text[If[ind == 2, Reverse[ticks], ticks][[i]],
    ptsG[[ind, i]] + off], ang], {i, Length[ticks]}]
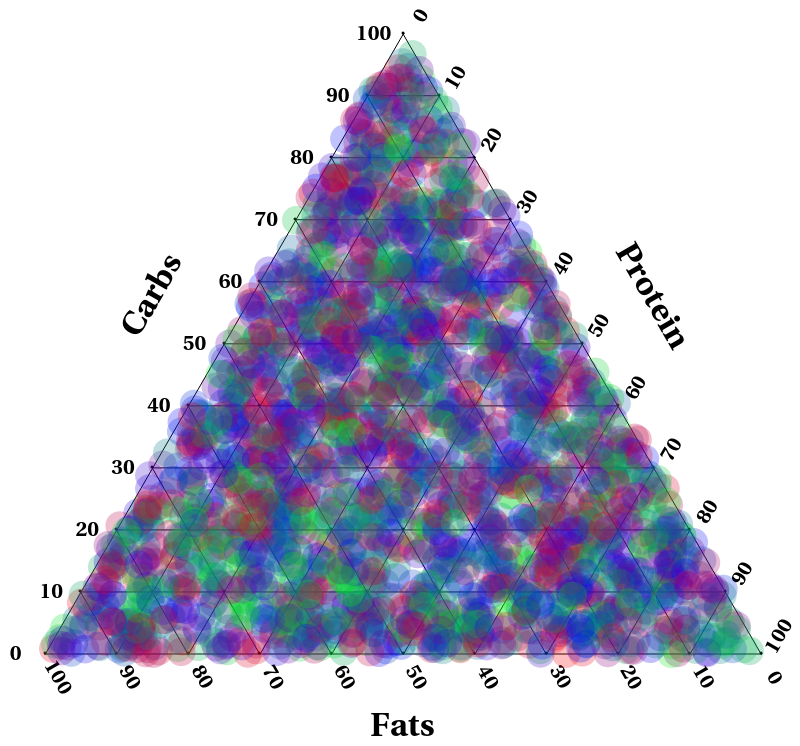
Finally draw it! Here sleep is a number between 0 and 1 with 0 being red, 1/2 being blue, 1 being green and anything in between a proportional blend between the 23.
Graphics[{Point /@ pts, labels, Line /@ lines, mkTicks[1, rot, {1/4, 1/4}],
 mkTicks[2, 0, {-2/5, 0}], mkTicks[3, -rot, {1/5,-1/3}], Opacity[0.25],
 {FaceForm@Blend[{Red, Blue,Green}, #[[-1]]], Disk[#[[1]], 0.2]} & /@ dataPts}]
ObviousObviously a non-random dataset should show some more revealing patterns. In my experience 3D graphs are really hard to make look nice and convey the data in a digestible way, I think this way should work nicely.


