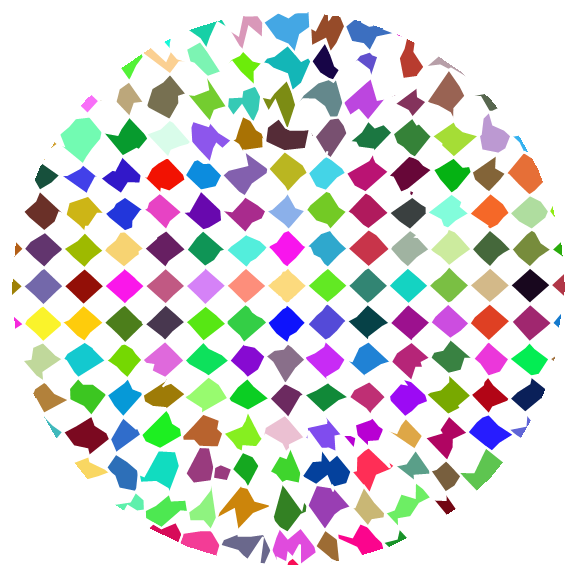
added 411 characters in body
Source Link
kglr
  • 400.5k
  • 18
  • 488
  • 929
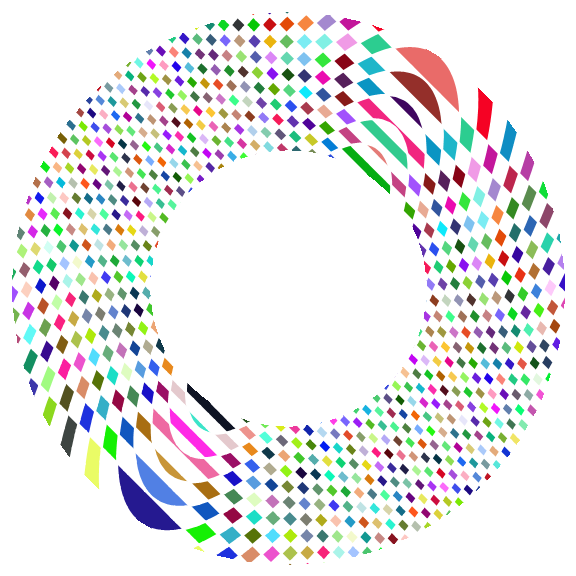
RegionPlot[Disk[]RegionPlot[Annulus[], Mesh -> {50, 20}, 
 MeshFunctions -> {#Sin[# #2+ #2] &, Norm[{# , # - #2}] &}, 
 MeshStyle -> {Directive[Thick, White], Directive[Thick, White]}, 
 PlotStyle -> None, 
 MeshShading -> Dynamic[{{RandomColor[], White}, {White, RandomColor[]}}], 
 BoundaryStyle -> None, Frame -> False, ImageSize -> Large]

enter image description hereenter image description here

RegionPlot[Disk[], Mesh -> {50, 20}, 
 MeshFunctions -> {# #2 &, Norm[{# , # - #2}] &}, 
 MeshStyle -> {Directive[Thick, White], Directive[Thick, White]}, 
 PlotStyle -> None, 
 MeshShading -> Dynamic[{{RandomColor[], White}, {White, RandomColor[]}}], 
 BoundaryStyle -> None, Frame -> False, ImageSize -> Large]

enter image description here

RegionPlot[Annulus[], Mesh -> {50, 20}, 
 MeshFunctions -> {Sin[# + #2] &, Norm[{# , # - #2}] &}, 
 MeshStyle -> {Directive[Thick, White], Directive[Thick, White]}, 
 PlotStyle -> None, 
 MeshShading -> Dynamic[{{RandomColor[], White}, {White, RandomColor[]}}], 
 BoundaryStyle -> None, Frame -> False, ImageSize -> Large]

enter image description here

added 411 characters in body
Source Link
kglr
  • 400.5k
  • 18
  • 488
  • 929
RegionPlot[Rectangle[]RegionPlot[Disk[], Mesh -> {50, 20}, 
 MeshFunctions -> {# #2 &, Norm[{# , # - #2}] &}, 
 MeshStyle -> {Directive[Thick, White], Directive[Thick, White]}, 
 PlotStyle -> None, 
 MeshShading -> Dynamic[{{RandomColor[], White}, {White, RandomColor[]}}], 
 BoundaryStyle -> None, Frame -> False, ImageSize -> Large]

enter image description here

RegionPlot[Disk[], Mesh -> 20, 
 MeshFunctions -> {# + #2  RandomReal[{1, 1.2}] &, 
     # + #2 RandomReal[{-1.2, -1.}] &}, 
 MeshStyle -> {Directive[Thick, White], Directive[Thick, White]}, 
 PlotStyle -> None, 
 MeshShading -> Dynamic[{{RandomColor[], White}, {White, 
     RandomColor[]}}], BoundaryStyle -> None, Frame -> False, 
 ImageSize -> Large]

enter image description here

Another example:enter image description here

RegionPlot[Rectangle[], Mesh -> 20, 
 MeshFunctions -> {# + #2  RandomReal[{1, 1.2}] &, 
     # + #2 RandomReal[{-1.2, -1.}] &}, 
 MeshStyle -> {Directive[Thick, White], Directive[Thick, White]}, 
 PlotStyle -> None, 
 MeshShading -> Dynamic[{{RandomColor[], White}, {White, 
     RandomColor[]}}], BoundaryStyle -> None, Frame -> False, 
 ImageSize -> Large]

enter image description here

Another example:

RegionPlot[Disk[], Mesh -> {50, 20}, 
 MeshFunctions -> {# #2 &, Norm[{# , # - #2}] &}, 
 MeshStyle -> {Directive[Thick, White], Directive[Thick, White]}, 
 PlotStyle -> None, 
 MeshShading -> Dynamic[{{RandomColor[], White}, {White, RandomColor[]}}], 
 BoundaryStyle -> None, Frame -> False, ImageSize -> Large]

enter image description here

RegionPlot[Disk[], Mesh -> 20, 
 MeshFunctions -> {# + #2  RandomReal[{1, 1.2}] &, 
     # + #2 RandomReal[{-1.2, -1.}] &}, 
 MeshStyle -> {Directive[Thick, White], Directive[Thick, White]}, 
 PlotStyle -> None, 
 MeshShading -> Dynamic[{{RandomColor[], White}, {White, 
     RandomColor[]}}], BoundaryStyle -> None, Frame -> False, 
 ImageSize -> Large]

enter image description here

added 2 characters in body
Source Link
kglr
  • 400.5k
  • 18
  • 488
  • 929

You can use RegionPlot and the options MeshFunctions + Mesh + MeshStyle

RegionPlot[Rectangle[], Mesh -> 50, 
 MeshFunctions -> {#1 + #2 &, #1 - #2 &}, 
 MeshStyle -> {Directive[Thin, Blue], Directive[Thin, Red]}, 
 PlotStyle -> None, BoundaryStyle -> None, Frame -> False]
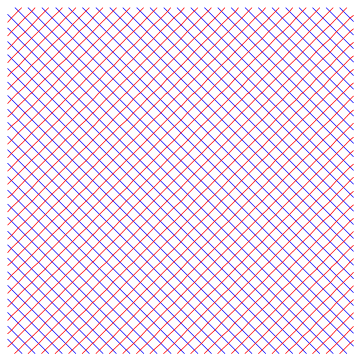
enter image description here

Add the option MeshShading -> {{White, Cyan}, {Orange, White}} to get
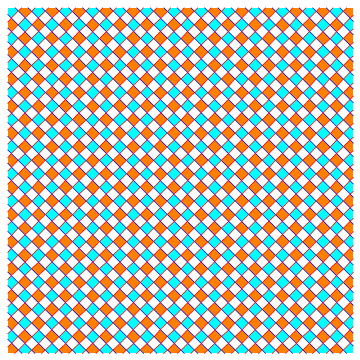
enter image description here

RegionPlot[Rectangle[], Mesh -> 15, 
 MeshFunctions -> {#1 + 2 #2 &, # - 2 #2 &}, 
 MeshStyle -> {Directive[Thick, White], Directive[Thick, White]}, 
 PlotStyle -> None, 
 MeshShading -> Dynamic[{{RandomColor[], RandomColor[]}, {RandomColor[], 
     RandomColor[]}}],
 BoundaryStyle -> None, Frame -> False, ImageSize -> Large]
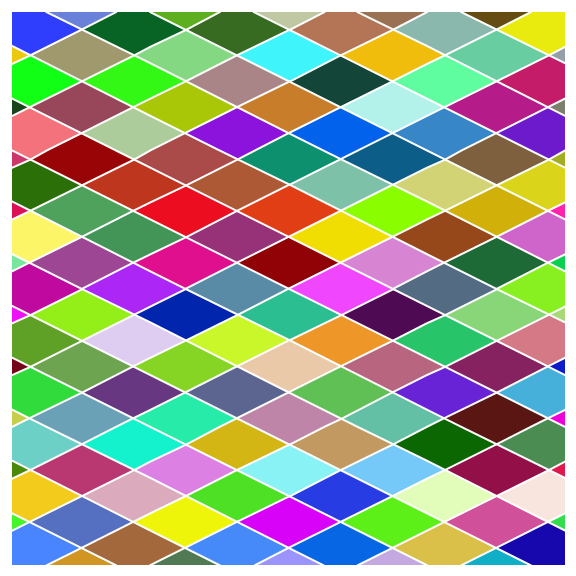
enter image description here

RegionPlot[Rectangle[], Mesh -> 20, 
 MeshFunctions -> {# + #2  RandomReal[{1, 1.2}] &, 
     # + #2 RandomReal[{-1.2, -1.}] &}, 
 MeshStyle -> {Directive[Thick, White], Directive[Thick, White]}, 
 PlotStyle -> None, 
 MeshShading -> Dynamic[{{RandomColor[], White}, {White, 
     RandomColor[]}}], BoundaryStyle -> None, Frame -> False, 
 ImageSize -> Large]

enter image description here Another

Another example:

Block[{z = u + I v, pa = PadeApproximant[Exp[z], {z, 0, {5, 0}}]}, 
 RegionPlot[Abs[pa/Exp[w]]Exp[z]] > 1 /. w -> z, {u, -4, 4}, {v, -4, 4}, 
  ImageSize -> Large, PlotPoints -> 100, Mesh -> 70, 
  MeshFunctions -> {#1 + #2 &, #1 - #2 &},
  MeshShading -> {{White, Cyan}, {Orange, White}}, 
  MeshStyle -> {Directive[AbsoluteThickness[1], Blue], 
    Directive[AbsoluteThickness[1], Red]}, PlotStyle -> None, 
  BoundaryStyle -> None, Frame -> False]]
enter image description here

See also: This answer to a related Q/A

You can use RegionPlot and the options MeshFunctions + Mesh + MeshStyle

RegionPlot[Rectangle[], Mesh -> 50, 
 MeshFunctions -> {#1 + #2 &, #1 - #2 &}, 
 MeshStyle -> {Directive[Thin, Blue], Directive[Thin, Red]}, 
 PlotStyle -> None, BoundaryStyle -> None, Frame -> False]

enter image description here

Add the option MeshShading -> {{White, Cyan}, {Orange, White}} to get

enter image description here

RegionPlot[Rectangle[], Mesh -> 15, 
 MeshFunctions -> {#1 + 2 #2 &, # - 2 #2 &}, 
 MeshStyle -> {Directive[Thick, White], Directive[Thick, White]}, 
 PlotStyle -> None, 
 MeshShading -> Dynamic[{{RandomColor[], RandomColor[]}, {RandomColor[], 
     RandomColor[]}}],
 BoundaryStyle -> None, Frame -> False, ImageSize -> Large]

enter image description here

RegionPlot[Rectangle[], Mesh -> 20, 
 MeshFunctions -> {# + #2  RandomReal[{1, 1.2}] &, 
     # + #2 RandomReal[{-1.2, -1.}] &}, 
 MeshStyle -> {Directive[Thick, White], Directive[Thick, White]}, 
 PlotStyle -> None, 
 MeshShading -> Dynamic[{{RandomColor[], White}, {White, 
     RandomColor[]}}], BoundaryStyle -> None, Frame -> False, 
 ImageSize -> Large]

enter image description here Another example:

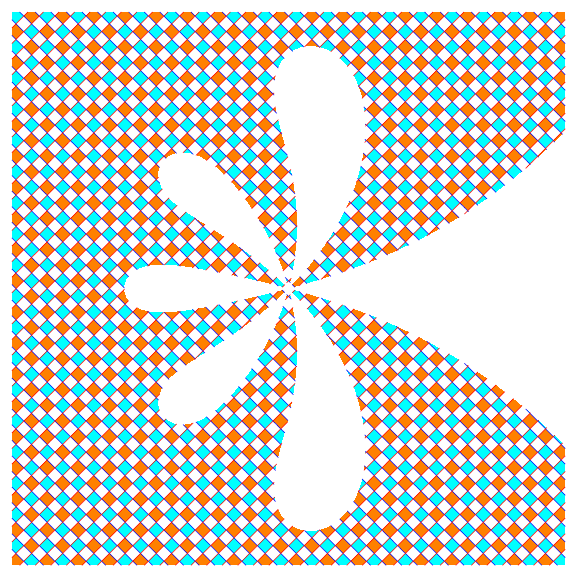
Block[{z = u + I v, pa = PadeApproximant[Exp[z], {z, 0, {5, 0}}]}, 
 RegionPlot[Abs[pa/Exp[w]] > 1 /. w -> z, {u, -4, 4}, {v, -4, 4}, 
  ImageSize -> Large, PlotPoints -> 100, Mesh -> 70, 
  MeshFunctions -> {#1 + #2 &, #1 - #2 &},
  MeshShading -> {{White, Cyan}, {Orange, White}}, 
  MeshStyle -> {Directive[AbsoluteThickness[1], Blue], 
    Directive[AbsoluteThickness[1], Red]}, PlotStyle -> None, 
  BoundaryStyle -> None, Frame -> False]]

enter image description here

See also: This answer to a related Q/A

You can use RegionPlot and the options MeshFunctions + Mesh + MeshStyle

RegionPlot[Rectangle[], Mesh -> 50, 
 MeshFunctions -> {#1 + #2 &, #1 - #2 &}, 
 MeshStyle -> {Directive[Thin, Blue], Directive[Thin, Red]}, 
 PlotStyle -> None, BoundaryStyle -> None, Frame -> False]

enter image description here

Add the option MeshShading -> {{White, Cyan}, {Orange, White}} to get

enter image description here

RegionPlot[Rectangle[], Mesh -> 15, 
 MeshFunctions -> {#1 + 2 #2 &, # - 2 #2 &}, 
 MeshStyle -> {Directive[Thick, White], Directive[Thick, White]}, 
 PlotStyle -> None, 
 MeshShading -> Dynamic[{{RandomColor[], RandomColor[]}, {RandomColor[], 
     RandomColor[]}}],
 BoundaryStyle -> None, Frame -> False, ImageSize -> Large]

enter image description here

RegionPlot[Rectangle[], Mesh -> 20, 
 MeshFunctions -> {# + #2  RandomReal[{1, 1.2}] &, 
     # + #2 RandomReal[{-1.2, -1.}] &}, 
 MeshStyle -> {Directive[Thick, White], Directive[Thick, White]}, 
 PlotStyle -> None, 
 MeshShading -> Dynamic[{{RandomColor[], White}, {White, 
     RandomColor[]}}], BoundaryStyle -> None, Frame -> False, 
 ImageSize -> Large]

enter image description here

Another example:

Block[{z = u + I v, pa = PadeApproximant[Exp[z], {z, 0, {5, 0}}]}, 
 RegionPlot[Abs[pa/Exp[z]] > 1, {u, -4, 4}, {v, -4, 4}, 
  ImageSize -> Large, PlotPoints -> 100, Mesh -> 70, 
  MeshFunctions -> {#1 + #2 &, #1 - #2 &},
  MeshShading -> {{White, Cyan}, {Orange, White}}, 
  MeshStyle -> {Directive[AbsoluteThickness[1], Blue], 
    Directive[AbsoluteThickness[1], Red]}, PlotStyle -> None, 
  BoundaryStyle -> None, Frame -> False]]

enter image description here

See also: This answer to a related Q/A
added 489 characters in body
Source Link
kglr
  • 400.5k
  • 18
  • 488
  • 929
Loading
added 551 characters in body
Source Link
kglr
  • 400.5k
  • 18
  • 488
  • 929
Loading
Source Link
kglr
  • 400.5k
  • 18
  • 488
  • 929
Loading