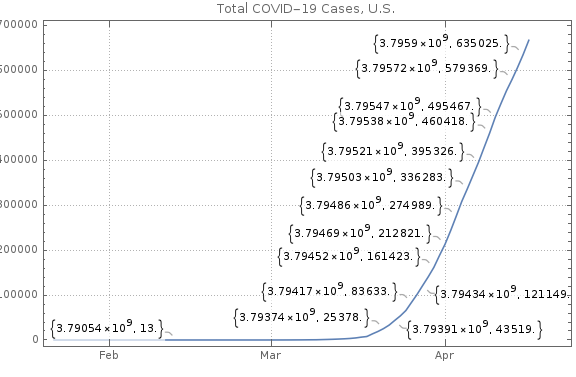
Working on a DateListPlot in Mathematica 12.1, and I only want to label the last point in the resulting chart with the second value (the number of COVID-19 cases). How?
Here's the code I have thus far (minus the first line, which is a CloudConnect command to get the data.) The ResourceObject call in the first line below is an effort to force it to get the latest data.
resource = ResourceObject["Epidemic Data for Novel Coronavirus COVID-19"];
data = ResourceData["Epidemic Data for Novel Coronavirus COVID-19"][Select[MatchQ[Entity["Country","UnitedStates"],#Country]&&!MissingQ[#AdministrativeDivision]&]][GroupBy["Country"]][ All, Total, #ConfirmedCases &];
diffs = Differences[data[Entity["Country","UnitedStates"]]];
Export["/home/pi/Pictures/COVIDCharts.png",Row[{DateListPlot[data,PlotLabel->"Total COVID-19 Cases, U.S.", PlotRange->All,PlotTheme->"Detailed",ImageSize->Large,LabelingFunction->(# &)],
DateListPlot[diffs,PlotLabel->"Daily New Cases Reported, U.S.", PlotRange->All,PlotTheme->"Detailed",ImageSize->Large,LabelingFunction->(# &)]}]]

