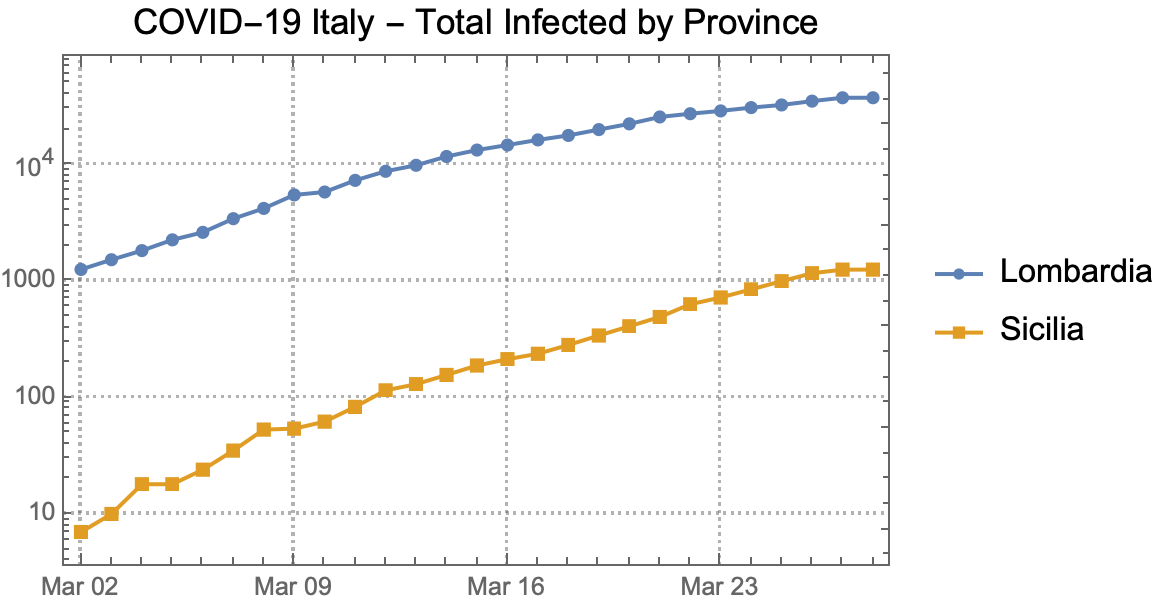
Update Plot data for several regions
provinces = {"lombardia", "sicilia"};
dataByProvince = covid19Italy /@ provinces;

dataByProvince //
  Map[(KeyTake[#, {"date", "total infected"}] &), #, {2}] & //
  Values //
  Flatten[#, 1] & //
  DateListPlot[#,
   ScalingFunctions -> "Log",
   PlotLegends -> Capitalize@provinces,
   PlotMarkers -> Automatic,
   PlotTheme -> "Detailed",
   PlotLabel -> Style["COVID-19 Italy - Total Infected by Province", 14, Black]] &
That code looks quite complicated. Here is an alternative (and I think, simpler) implementation.
covid19Italy[region_] :=
 Module[{header, convertDelta, insertZero, data, processedData},

  header = {"date", "total infected", "total infected change",
    "total deaths", "total deaths change", "total healed",
    "total healed change"};

  insertZero[n_] := ToString[n] <> " (+0)";

  convertDelta[s_] :=
   StringReplace[s, {"(" -> "", ")" -> ""}] // StringSplit //
    ToExpression;

  data = Import["https://statistichecoronavirus.it/regioni-coronavirus-italia/" <>
      region <> "/", "Data"][[2, 2]];

  processedData =
   data //
       MapAt[StringReplace[" In aggiornamento" -> ""] /*
         (DateObject[{# <> "/2020", {"Day", "/", "Month", "/", "Year"}}] &), #, {All, 1}] & //
      MapAt[insertZero, #, {-1, 2 ;;}] & //
     MapAt[convertDelta, #, {All, 2 ;;}] & //
    Map[Flatten];
  <|region -> (AssociationThread[header -> #] &) /@ processedData|>]

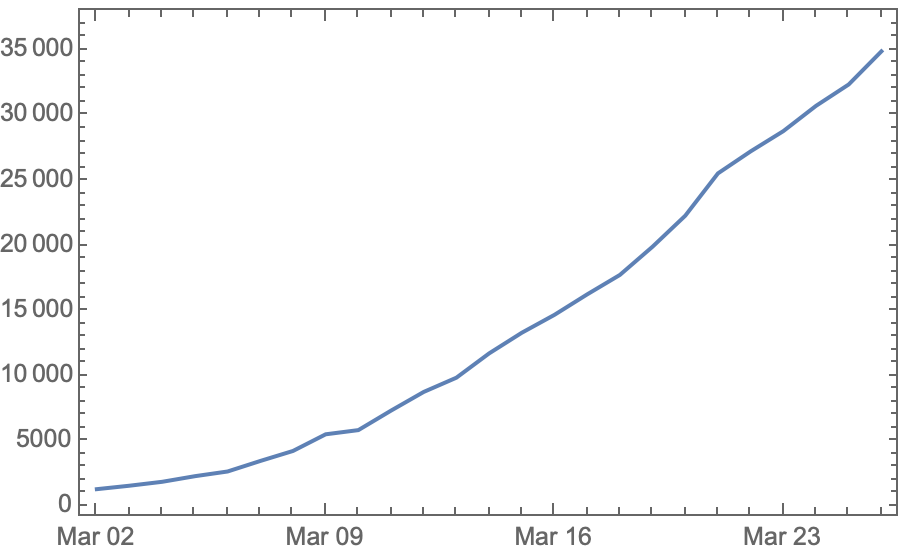
lombardia = covid19Italy["lombardia"];

lombardia // Map[KeyTake[#, {"date", "total infected"}] &] // DateListPlot


