added 253 characters in body
Source Link
kglr
  • 400.5k
  • 18
  • 488
  • 929

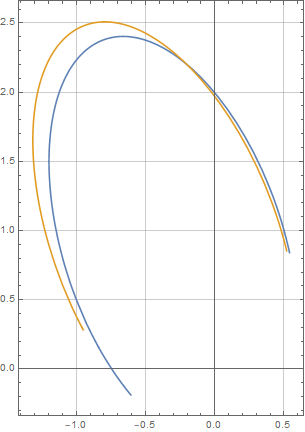
An alternative approach is to use ParametricNDSolveValue with the `second argument set to the function you want to plot:

  1. If you use ParametricNDSolveValue you don't have run NDSolve for each 4-tuple of input parameters.
  2. Using the function you want to plot as the second argument of ParametricNDSolveValue you can use the output directly in plot functions without additional processing.
 

ClearAll[pndsv]
pndsv = ParametricNDSolveValue[{r''[t] == r[t]*ϕ'[t]^2 - 1/r[t], ϕ'[t] == d/r[t]^2, 
    ϕ[0] == a, r[0] == b, r'[0] == c},
   {r[#] Cos[ϕ[#]], r[#] Sin[ϕ[#]]} &, 
   {t, 0, 200}, 
   {a, b, c, d}]; 

params = Transpose[{vTangential/r0, r0, vRadial, L}]; 

ParametricPlot[Evaluate[pndsv[##][t] & @@@ params], {t, 0, 2  Pi}, 
 GridLines -> Automatic, Frame -> True]

enter image description here

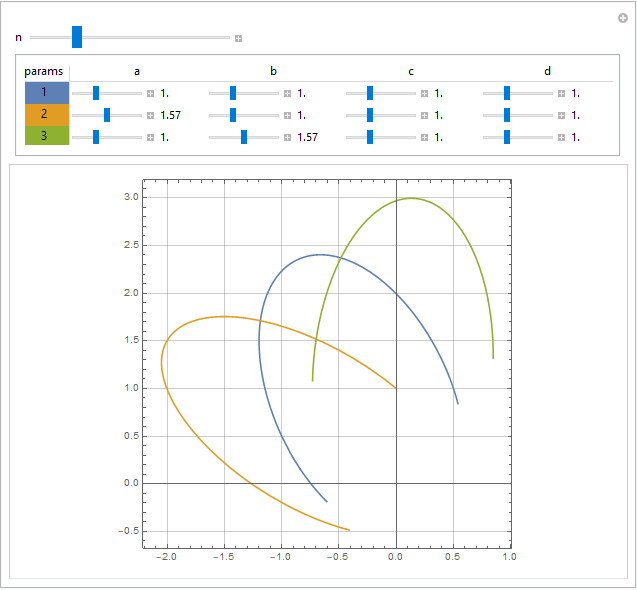
Interactively set up to 10 sets of parameters using control label styles as legend for the curves shown:

k = 10;
Manipulate[ParametricPlot[Evaluate[pndsv[##][t] & @@@ Take[psets, n, 4]], {t, 0, 2  Pi}, 
    GridLines -> Automatic, Frame -> True, ImageSize -> 400, AspectRatio -> 1],
  {{psets, ConstantArray[1., {k, 4}]}, None},
  {{n, 3}, 1, 10, 1}, 
  Dynamic[Panel[Grid[Prepend[#, {"params", "a", "b", "c", "d"}] &@
    MapIndexed[Prepend[#, #2[[1]]] &, Outer[Manipulator[Dynamic[psets[[#1, #2]]], {0, 3},
         Appearance -> "Labeled", ImageSize -> Tiny] &, Range[n], Range[4]]], 
   FrameStyle -> LightGray, 
   Background -> {None, None, {# + 1, 1} -> ColorData[97]@# & /@ Range[n]}, 
   Dividers -> {{False, True}, {False, True}}]]], 
 Alignment -> Center]

enter image description here

An alternative approach is to use ParametricNDSolveValue with the `second argument set to the function you want to plot:

ClearAll[pndsv]
pndsv = ParametricNDSolveValue[{r''[t] == r[t]*ϕ'[t]^2 - 1/r[t], ϕ'[t] == d/r[t]^2, 
    ϕ[0] == a, r[0] == b, r'[0] == c},
   {r[#] Cos[ϕ[#]], r[#] Sin[ϕ[#]]} &, 
   {t, 0, 200}, 
   {a, b, c, d}]; 

params = Transpose[{vTangential/r0, r0, vRadial, L}]; 

ParametricPlot[Evaluate[pndsv[##][t] & @@@ params], {t, 0, 2  Pi}, 
 GridLines -> Automatic, Frame -> True]

enter image description here

Interactively set up to 10 sets of parameters:

k = 10;
Manipulate[ParametricPlot[Evaluate[pndsv[##][t] & @@@ Take[psets, n, 4]], {t, 0, 2  Pi}, 
    GridLines -> Automatic, Frame -> True, ImageSize -> 400, AspectRatio -> 1],
  {{psets, ConstantArray[1., {k, 4}]}, None},
  {{n, 3}, 1, 10, 1}, 
  Dynamic[Panel[Grid[Prepend[#, {"params", "a", "b", "c", "d"}] &@
    MapIndexed[Prepend[#, #2[[1]]] &, Outer[Manipulator[Dynamic[psets[[#1, #2]]], {0, 3},
         Appearance -> "Labeled", ImageSize -> Tiny] &, Range[n], Range[4]]], 
   FrameStyle -> LightGray, 
   Background -> {None, None, {# + 1, 1} -> ColorData[97]@# & /@ Range[n]}, 
   Dividers -> {{False, True}, {False, True}}]]], 
 Alignment -> Center]
enter image description here

An alternative approach:

  1. If you use ParametricNDSolveValue you don't have run NDSolve for each 4-tuple of input parameters.
  2. Using the function you want to plot as the second argument of ParametricNDSolveValue you can use the output directly in plot functions without additional processing.
 

ClearAll[pndsv]
pndsv = ParametricNDSolveValue[{r''[t] == r[t]*ϕ'[t]^2 - 1/r[t], ϕ'[t] == d/r[t]^2, 
    ϕ[0] == a, r[0] == b, r'[0] == c},
   {r[#] Cos[ϕ[#]], r[#] Sin[ϕ[#]]} &, 
   {t, 0, 200}, 
   {a, b, c, d}]; 

params = Transpose[{vTangential/r0, r0, vRadial, L}]; 

ParametricPlot[Evaluate[pndsv[##][t] & @@@ params], {t, 0, 2  Pi}, 
 GridLines -> Automatic, Frame -> True]

enter image description here

Interactively set up to 10 sets of parameters using control label styles as legend for the curves shown:

k = 10;
Manipulate[ParametricPlot[Evaluate[pndsv[##][t] & @@@ Take[psets, n, 4]], {t, 0, 2  Pi}, 
    GridLines -> Automatic, Frame -> True, ImageSize -> 400, AspectRatio -> 1],
  {{psets, ConstantArray[1., {k, 4}]}, None},
  {{n, 3}, 1, 10, 1}, 
  Dynamic[Panel[Grid[Prepend[#, {"params", "a", "b", "c", "d"}] &@
    MapIndexed[Prepend[#, #2[[1]]] &, Outer[Manipulator[Dynamic[psets[[#1, #2]]], {0, 3},
         Appearance -> "Labeled", ImageSize -> Tiny] &, Range[n], Range[4]]], 
   FrameStyle -> LightGray, 
   Background -> {None, None, {# + 1, 1} -> ColorData[97]@# & /@ Range[n]}, 
   Dividers -> {{False, True}, {False, True}}]]], 
 Alignment -> Center]
enter image description here

Source Link
kglr
  • 400.5k
  • 18
  • 488
  • 929

An alternative approach is to use ParametricNDSolveValue with the `second argument set to the function you want to plot:

ClearAll[pndsv]
pndsv = ParametricNDSolveValue[{r''[t] == r[t]*ϕ'[t]^2 - 1/r[t], ϕ'[t] == d/r[t]^2, 
    ϕ[0] == a, r[0] == b, r'[0] == c},
   {r[#] Cos[ϕ[#]], r[#] Sin[ϕ[#]]} &, 
   {t, 0, 200}, 
   {a, b, c, d}]; 

params = Transpose[{vTangential/r0, r0, vRadial, L}]; 

ParametricPlot[Evaluate[pndsv[##][t] & @@@ params], {t, 0, 2  Pi}, 
 GridLines -> Automatic, Frame -> True]

enter image description here

Interactively set up to 10 sets of parameters:

k = 10;
Manipulate[ParametricPlot[Evaluate[pndsv[##][t] & @@@ Take[psets, n, 4]], {t, 0, 2  Pi}, 
    GridLines -> Automatic, Frame -> True, ImageSize -> 400, AspectRatio -> 1],
  {{psets, ConstantArray[1., {k, 4}]}, None},
  {{n, 3}, 1, 10, 1}, 
  Dynamic[Panel[Grid[Prepend[#, {"params", "a", "b", "c", "d"}] &@
    MapIndexed[Prepend[#, #2[[1]]] &, Outer[Manipulator[Dynamic[psets[[#1, #2]]], {0, 3},
         Appearance -> "Labeled", ImageSize -> Tiny] &, Range[n], Range[4]]], 
   FrameStyle -> LightGray, 
   Background -> {None, None, {# + 1, 1} -> ColorData[97]@# & /@ Range[n]}, 
   Dividers -> {{False, True}, {False, True}}]]], 
 Alignment -> Center]

enter image description here