added 1032 characters in body
Source Link
Vitaliy Kaurov
  • 73.4k
  • 9
  • 206
  • 365

4D3D + color + tabulation

Multicolumn[
Table[
DensityPlot3D[
    Cos[Pi a]Cos[Pi b]+Cos[Pi g]Cos[Pi d],
    {a,0,1},{b,0,1},{g,0,1},
    PlotLabel->"d = Pi*"<>ToString[N[d,2]],
    ColorFunction->"TemperatureMap",
    PlotTheme->"Detailed",
    PlotLegends->None],
{d,0,1,1/15}]
,4]

3D + color + tabulation

enter image description here

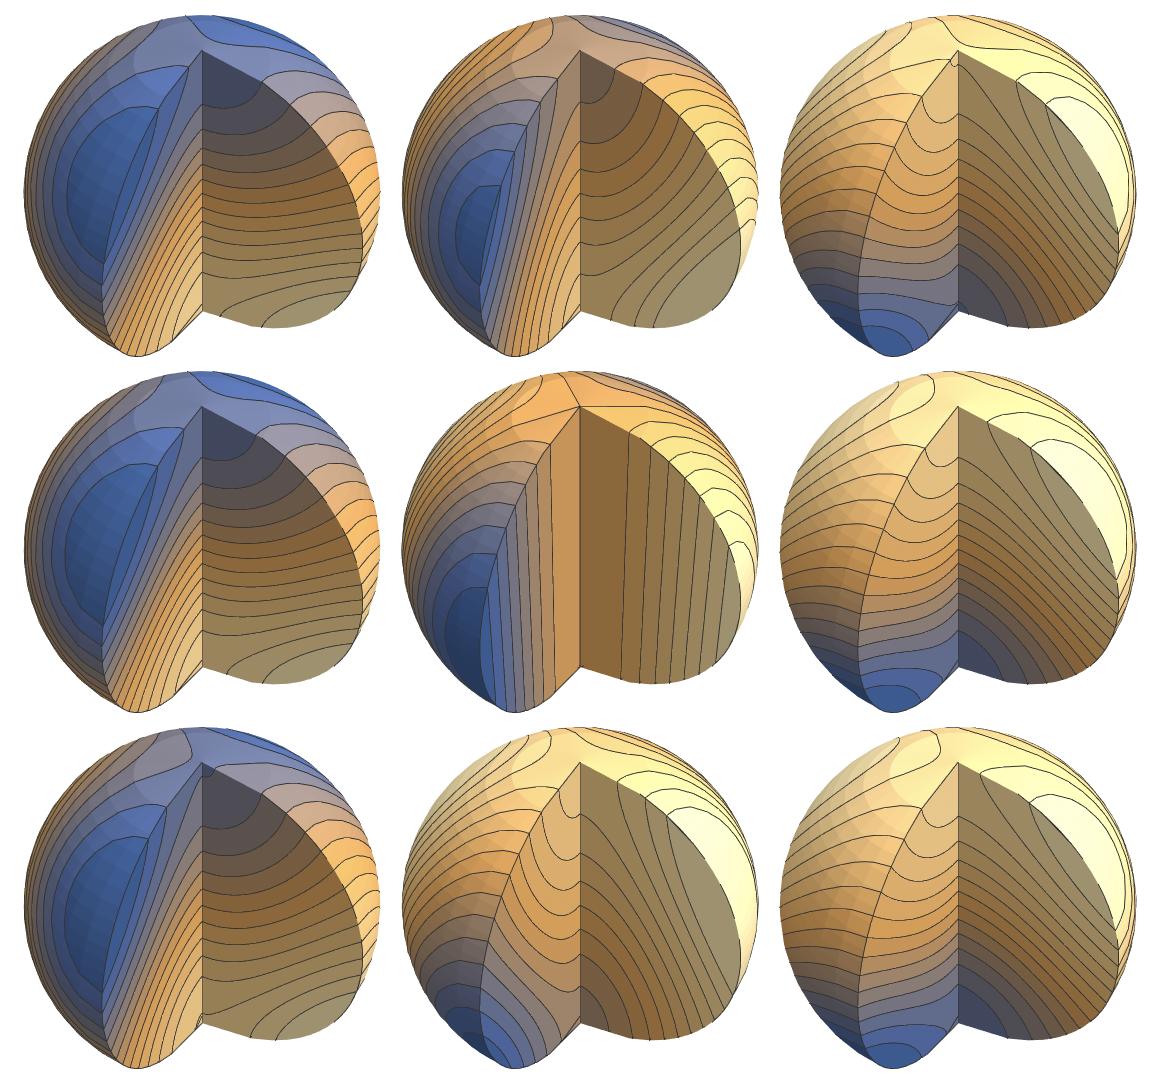
This one is a bit unorthodox, but I just love the look of it.

Multicolumn[
Table[
    SliceContourPlot3D
        [Cos[Pi a]Cos[Pi b]+Cos[Pi g]Cos[Pi d],
        {"CenterCutSphere",Pi/2,0},
        {a,0,1},{b,0,1},{g,0,1},
        ViewPoint->{2.4,-0.6,2.3},
        Boxed->False,
        Axes->False,
        Contours->15,
        Method->{"ShrinkWrap"->True}],
{d,0,1,1/8}],
4]

3D + color + tabulation

enter image description here

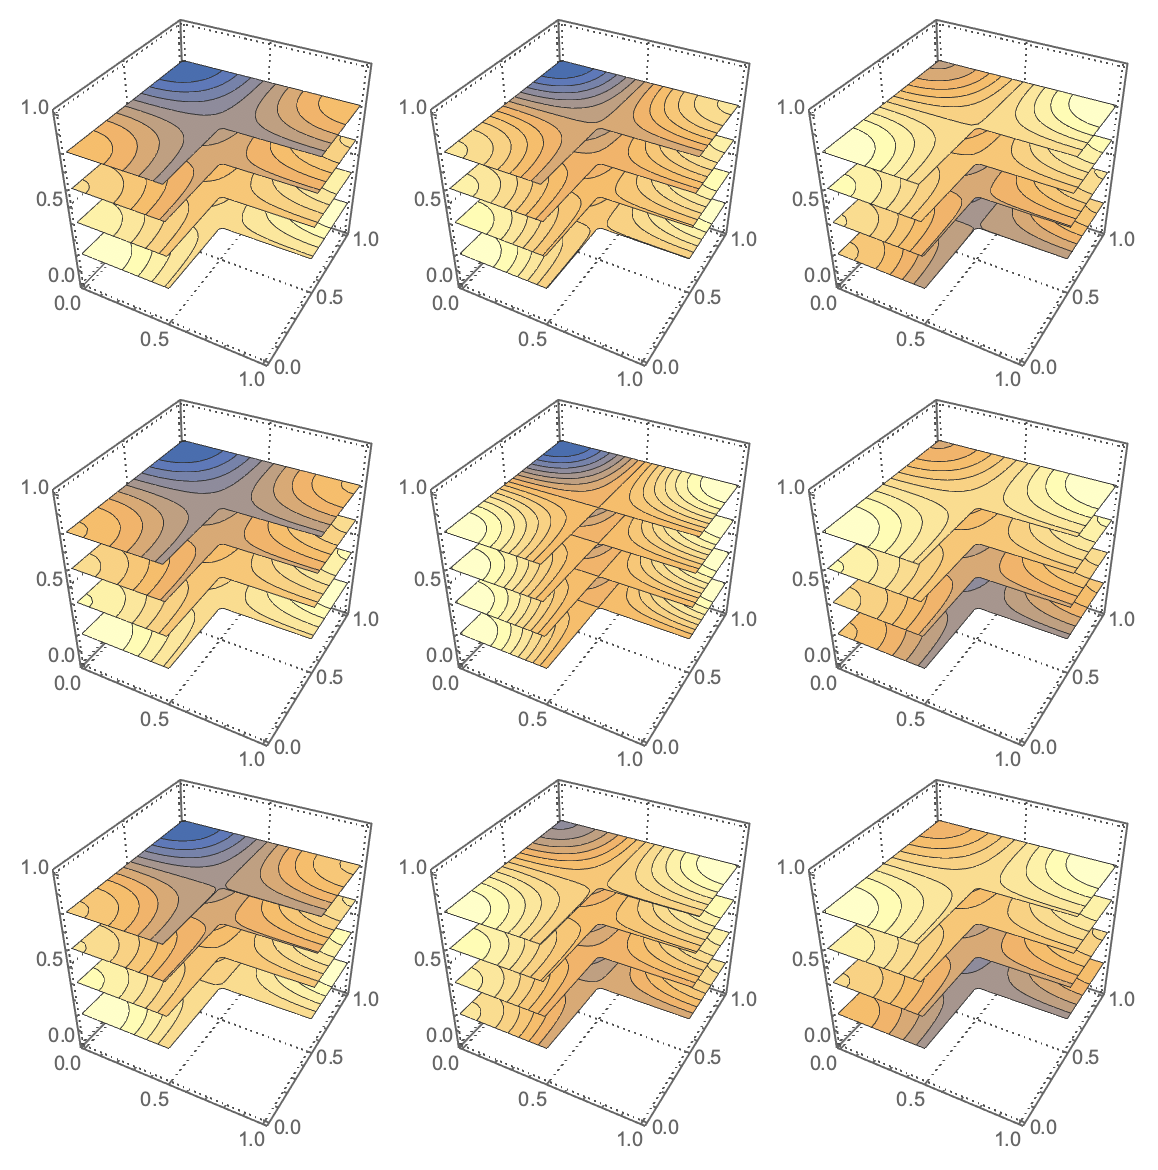
One more take on this...

Multicolumn[
Table[
    SliceContourPlot3D
        [Cos[Pi a]Cos[Pi b]+Cos[Pi g]Cos[Pi d],
        {"ZStackedPlanes",4},
        {a,0,1},{b,0,1},{g,0,1},
        RegionFunction->Function[{x,y,z},x<1/2||y>1/2],
        Contours->15,
        PlotTheme->"Detailed",
        PlotLegends->False,
        Method->{"ShrinkWrap"->True}],
{d,0,1,1/8}],
4]

4D + tabulation

Multicolumn[
Table[
DensityPlot3D[
    Cos[Pi a]Cos[Pi b]+Cos[Pi g]Cos[Pi d],
    {a,0,1},{b,0,1},{g,0,1},
    PlotLabel->"d = Pi*"<>ToString[N[d,2]],
    ColorFunction->"TemperatureMap",
    PlotTheme->"Detailed",
    PlotLegends->None],
{d,0,1,1/15}]
,4]

3D + color + tabulation

Multicolumn[
Table[
DensityPlot3D[
    Cos[Pi a]Cos[Pi b]+Cos[Pi g]Cos[Pi d],
    {a,0,1},{b,0,1},{g,0,1},
    PlotLabel->"d = Pi*"<>ToString[N[d,2]],
    ColorFunction->"TemperatureMap",
    PlotTheme->"Detailed",
    PlotLegends->None],
{d,0,1,1/15}]
,4]

3D + color + tabulation

enter image description here

This one is a bit unorthodox, but I just love the look of it.

Multicolumn[
Table[
    SliceContourPlot3D
        [Cos[Pi a]Cos[Pi b]+Cos[Pi g]Cos[Pi d],
        {"CenterCutSphere",Pi/2,0},
        {a,0,1},{b,0,1},{g,0,1},
        ViewPoint->{2.4,-0.6,2.3},
        Boxed->False,
        Axes->False,
        Contours->15,
        Method->{"ShrinkWrap"->True}],
{d,0,1,1/8}],
4]

3D + color + tabulation

enter image description here

One more take on this...

Multicolumn[
Table[
    SliceContourPlot3D
        [Cos[Pi a]Cos[Pi b]+Cos[Pi g]Cos[Pi d],
        {"ZStackedPlanes",4},
        {a,0,1},{b,0,1},{g,0,1},
        RegionFunction->Function[{x,y,z},x<1/2||y>1/2],
        Contours->15,
        PlotTheme->"Detailed",
        PlotLegends->False,
        Method->{"ShrinkWrap"->True}],
{d,0,1,1/8}],
4]
added 816 characters in body
Source Link
Vitaliy Kaurov
  • 73.4k
  • 9
  • 206
  • 365

Everywhere below I use a rescaled by Pi version with variable ranges $[0,1]$ -- it easier to understand it on the plots:

Cos[Pi a]Cos[Pi b]+Cos[Pi g]Cos[Pi d]

4D + tabulation

enter image description here

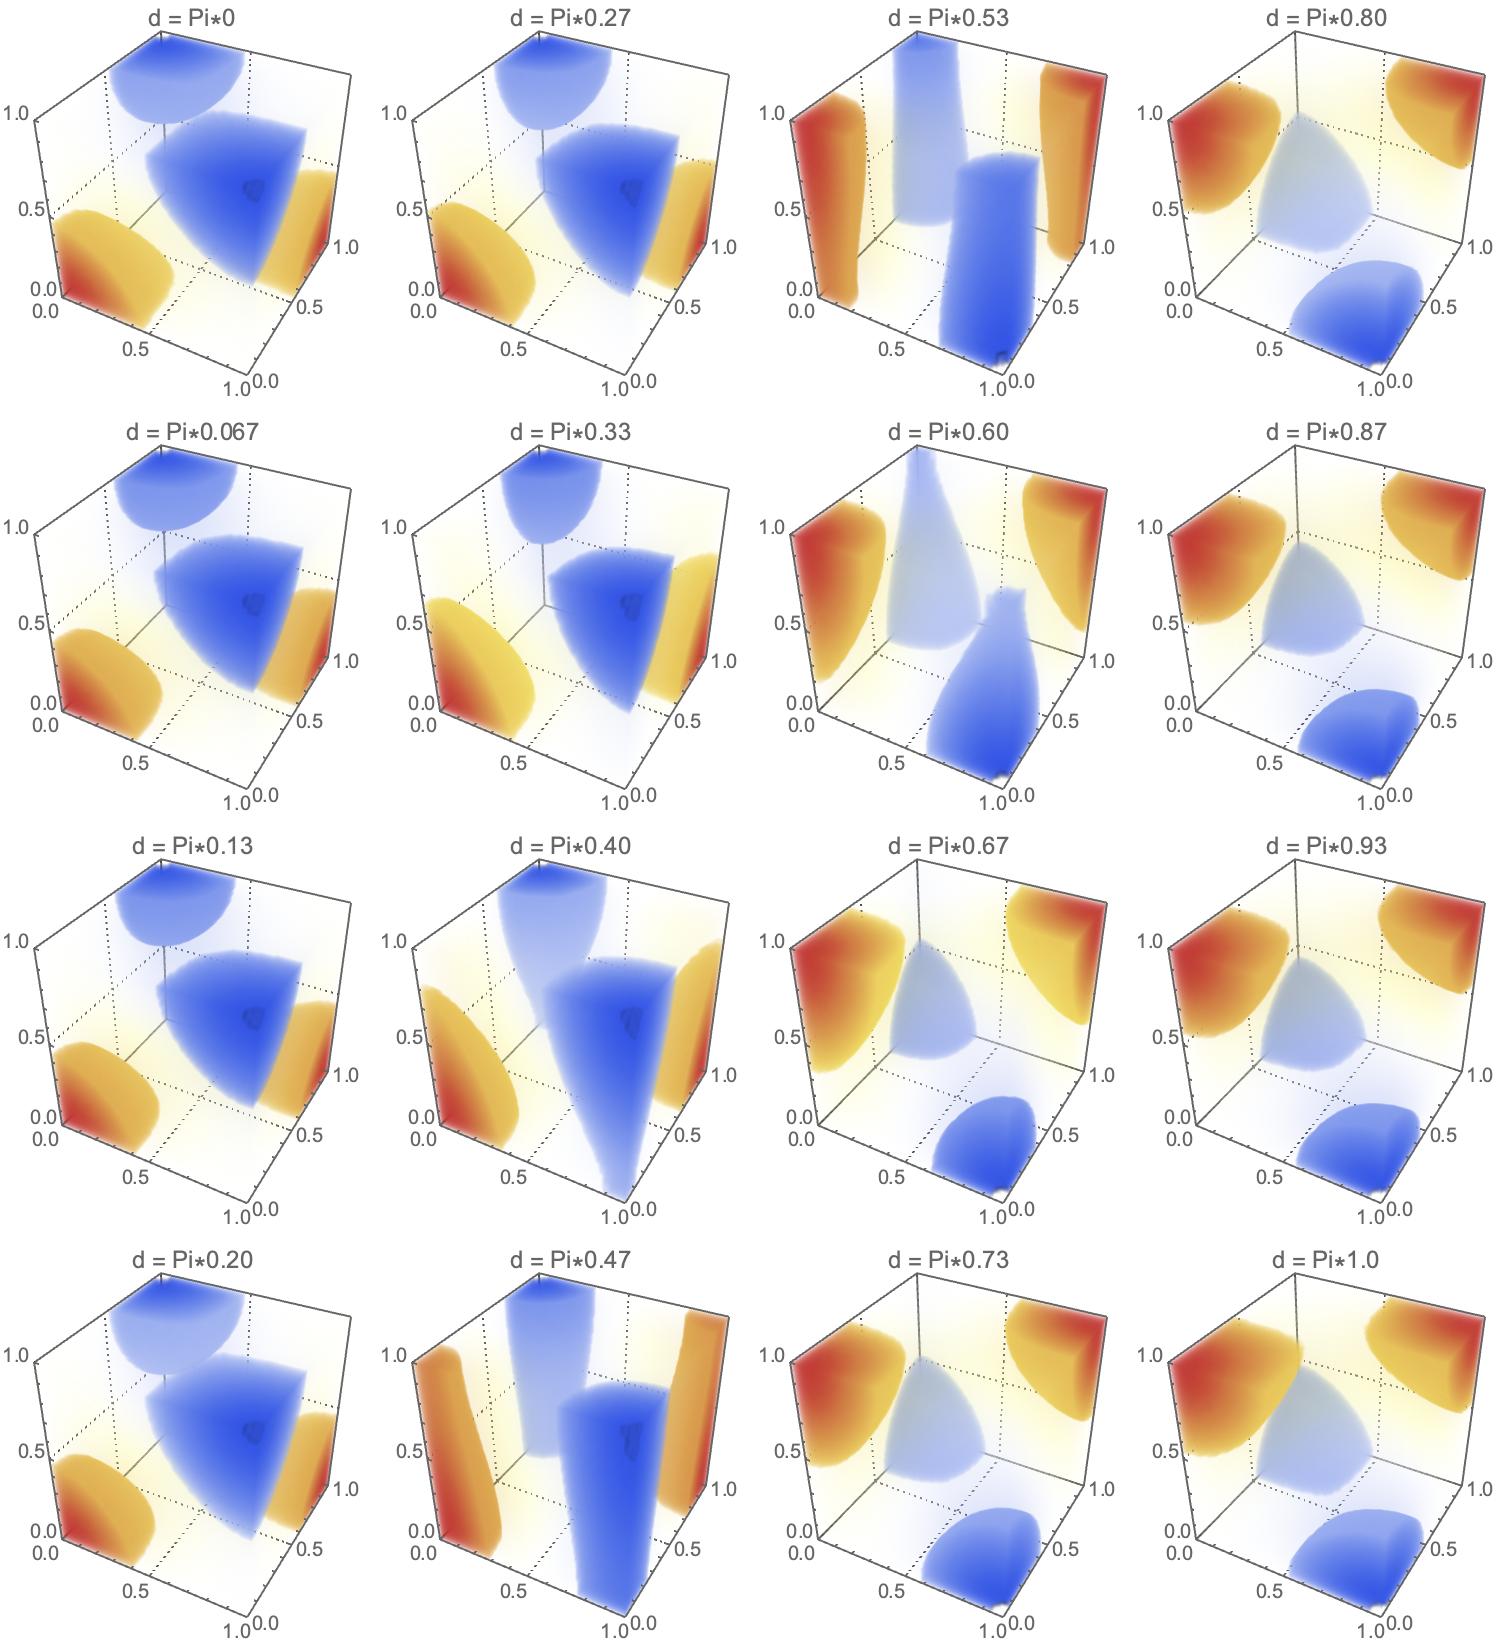
You can make usage of DensityPlot3D that gives you 4D plotting (3 axes and 4th color variable) and then run remaining 5th variable through a range of values. This code will give you the top image (explore options of DensityPlot3D to adapt to your needs):

Multicolumn[
Table[
DensityPlot3D[
    Cos[Pi a]Cos[Pi b]+Cos[Pi g]Cos[Pi d],
    {a,0,1},{b,0,1},{g,0,1},
    PlotLabel->"d = Pi*"<>ToString[N[d,2]],
    ColorFunction->"TemperatureMap",
    PlotTheme->"Detailed",
    PlotLegends->None],
{d,0,1,1/15}]
,4]

3D + multi-surface + animation

enter image description here

Alternatively you can use Plot3D surface for 3D, table of surfaces for the 4th, and animation for the 5th parameter. Here is the code for the animation above:

Manipulate[
    Plot3D[
    Table[Cos[Pi a]Cos[Pi b]+Cos[Pi g]Cos[Pi d],{b,0,1,1/2}],
    {a,0,1},{g,0,1},
    PlotPoints->15,
    SphericalRegion->True,
    ImageSize->{400,400},
    Mesh->10,
    MeshStyle->Opacity[.5],
    BoxRatios->1,
    ColorFunction->"Rainbow",
    AxesLabel->{a,g,f}],
{d,0,1}]

enter image description here

You can make usage of DensityPlot3D that gives you 4D plotting (3 axes and 4th color variable) and then run remaining 5th variable through a range of values. This code will give you the top image (explore options of DensityPlot3D to adapt to your needs):

Multicolumn[
Table[
DensityPlot3D[
    Cos[Pi a]Cos[Pi b]+Cos[Pi g]Cos[Pi d],
    {a,0,1},{b,0,1},{g,0,1},
    PlotLabel->"d = Pi*"<>ToString[N[d,2]],
    ColorFunction->"TemperatureMap",
    PlotTheme->"Detailed",
    PlotLegends->None],
{d,0,1,1/15}]
,4]

Everywhere below I use a rescaled by Pi version with variable ranges $[0,1]$ -- it easier to understand it on the plots:

Cos[Pi a]Cos[Pi b]+Cos[Pi g]Cos[Pi d]

4D + tabulation

enter image description here

You can make usage of DensityPlot3D that gives you 4D plotting (3 axes and 4th color variable) and then run remaining 5th variable through a range of values. This code will give you the top image (explore options of DensityPlot3D to adapt to your needs):

Multicolumn[
Table[
DensityPlot3D[
    Cos[Pi a]Cos[Pi b]+Cos[Pi g]Cos[Pi d],
    {a,0,1},{b,0,1},{g,0,1},
    PlotLabel->"d = Pi*"<>ToString[N[d,2]],
    ColorFunction->"TemperatureMap",
    PlotTheme->"Detailed",
    PlotLegends->None],
{d,0,1,1/15}]
,4]

3D + multi-surface + animation

enter image description here

Alternatively you can use Plot3D surface for 3D, table of surfaces for the 4th, and animation for the 5th parameter. Here is the code for the animation above:

Manipulate[
    Plot3D[
    Table[Cos[Pi a]Cos[Pi b]+Cos[Pi g]Cos[Pi d],{b,0,1,1/2}],
    {a,0,1},{g,0,1},
    PlotPoints->15,
    SphericalRegion->True,
    ImageSize->{400,400},
    Mesh->10,
    MeshStyle->Opacity[.5],
    BoxRatios->1,
    ColorFunction->"Rainbow",
    AxesLabel->{a,g,f}],
{d,0,1}]
Source Link
Vitaliy Kaurov
  • 73.4k
  • 9
  • 206
  • 365

enter image description here

You can make usage of DensityPlot3D that gives you 4D plotting (3 axes and 4th color variable) and then run remaining 5th variable through a range of values. This code will give you the top image (explore options of DensityPlot3D to adapt to your needs):

Multicolumn[
Table[
DensityPlot3D[
    Cos[Pi a]Cos[Pi b]+Cos[Pi g]Cos[Pi d],
    {a,0,1},{b,0,1},{g,0,1},
    PlotLabel->"d = Pi*"<>ToString[N[d,2]],
    ColorFunction->"TemperatureMap",
    PlotTheme->"Detailed",
    PlotLegends->None],
{d,0,1,1/15}]
,4]