Commonmark migration
Source Link

I tried to execute this simple command

Plot[Cosh[t] - Sinh[t] + Sin[t], {t, 0, 40}]

and this is the result I got

[![enter image description here][1]][1]enter image description here
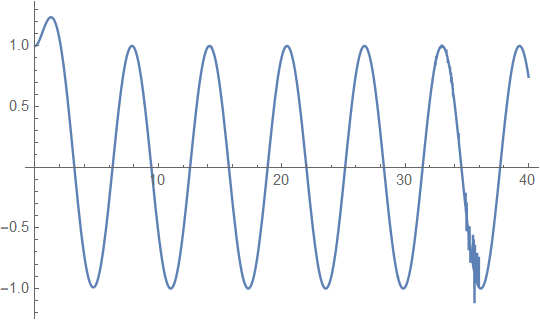
As you can see, there is an unexpected visual between $t=30$ and $t=40$. But when I used the identity $e^{-t}=\cosh{t}-\sinh{t}$, everything went fine. This command

Plot[Exp[-t] + Sin[t], {t, 0, 40}]

gives

[![enter image description here][2]][2]enter image description here
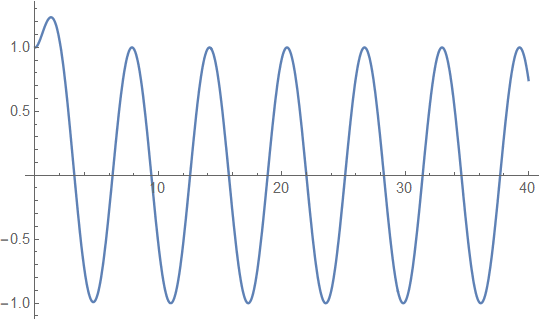
What's going on here? Can anyone reproduce this result? Is this a bug? I'm using MMA 12 64bit on Windows 10. [1]: https://i.sstatic.net/tGAvh.png [2]: https://i.sstatic.net/GusTr.png

I tried to execute this simple command

Plot[Cosh[t] - Sinh[t] + Sin[t], {t, 0, 40}]

and this is the result I got

[![enter image description here][1]][1]

As you can see, there is an unexpected visual between $t=30$ and $t=40$. But when I used the identity $e^{-t}=\cosh{t}-\sinh{t}$, everything went fine. This command

Plot[Exp[-t] + Sin[t], {t, 0, 40}]

gives

[![enter image description here][2]][2]

What's going on here? Can anyone reproduce this result? Is this a bug? I'm using MMA 12 64bit on Windows 10. [1]: https://i.sstatic.net/tGAvh.png [2]: https://i.sstatic.net/GusTr.png

I tried to execute this simple command

Plot[Cosh[t] - Sinh[t] + Sin[t], {t, 0, 40}]

and this is the result I got

enter image description here

As you can see, there is an unexpected visual between $t=30$ and $t=40$. But when I used the identity $e^{-t}=\cosh{t}-\sinh{t}$, everything went fine. This command

Plot[Exp[-t] + Sin[t], {t, 0, 40}]

gives

enter image description here

What's going on here? Can anyone reproduce this result? Is this a bug? I'm using MMA 12 64bit on Windows 10.

I tried to execute this simple command

Plot[Cosh[t] - Sinh[t] + Sin[t], {t, 0, 40}]

and this is the result I got

[![enter image description here][1]][1]

As you can see, there is an unexpected visual between $t=30$ and $t=40$. But when I used the identity $e^{-t}=\cosh{t}-\sinh{t}$, everything went fine. This command

Plot[Exp[-t] + Sin[t], {t, 0, 40}]

gives

[![enter image description here][2]][2]

What's going on here? Can anyone reproduce this result? Is this a bug? I'm using WMAMMA 12 64bit on Windows 10. [1]: https://i.sstatic.net/tGAvh.png [2]: https://i.sstatic.net/GusTr.png

I tried to execute this simple command

Plot[Cosh[t] - Sinh[t] + Sin[t], {t, 0, 40}]

and this is the result I got

[![enter image description here][1]][1]

As you can see, there is an unexpected visual between $t=30$ and $t=40$. But when I used the identity $e^{-t}=\cosh{t}-\sinh{t}$, everything went fine. This command

Plot[Exp[-t] + Sin[t], {t, 0, 40}]

gives

[![enter image description here][2]][2]

What's going on here? Can anyone reproduce this result? Is this a bug? I'm using WMA 12 64bit on Windows 10. [1]: https://i.sstatic.net/tGAvh.png [2]: https://i.sstatic.net/GusTr.png

I tried to execute this simple command

Plot[Cosh[t] - Sinh[t] + Sin[t], {t, 0, 40}]

and this is the result I got

[![enter image description here][1]][1]

As you can see, there is an unexpected visual between $t=30$ and $t=40$. But when I used the identity $e^{-t}=\cosh{t}-\sinh{t}$, everything went fine. This command

Plot[Exp[-t] + Sin[t], {t, 0, 40}]

gives

[![enter image description here][2]][2]

What's going on here? Can anyone reproduce this result? Is this a bug? I'm using MMA 12 64bit on Windows 10. [1]: https://i.sstatic.net/tGAvh.png [2]: https://i.sstatic.net/GusTr.png

added 34 characters in body
Source Link
Sukan
  • 475
  • 3
  • 7

I tried to execute this simple command

Plot[Cosh[t] - Sinh[t] + Sin[t], {t, 0, 40}]

and this is the result I got

[![enter image description here][1]][1]

As you can see, there is an unexpected visual between $t=30$ and $t=40$. But when I used the identity $e^{-t}=\cosh{t}-\sinh{t}$, everything went fine. This command

Plot[Exp[-t] + Sin[t], {t, 0, 40}]

gives

[![enter image description here][2]][2]

What's going on here? Can anyone reproduce this result? Is this a bug? I'm using WMA 12 64bit on Windows 10. [1]: https://i.sstatic.net/tGAvh.png [2]: https://i.sstatic.net/GusTr.png

I tried to execute this simple command

Plot[Cosh[t] - Sinh[t] + Sin[t], {t, 0, 40}]

and this is the result I got

[![enter image description here][1]][1]

As you can see, there is an unexpected visual between $t=30$ and $t=40$. But when I used the identity $e^{-t}=\cosh{t}-\sinh{t}$, everything went fine. This command

Plot[Exp[-t] + Sin[t], {t, 0, 40}]

gives

[![enter image description here][2]][2]

What's going on here? Is this a bug? I'm using WMA 12 64bit on Windows 10. [1]: https://i.sstatic.net/tGAvh.png [2]: https://i.sstatic.net/GusTr.png

I tried to execute this simple command

Plot[Cosh[t] - Sinh[t] + Sin[t], {t, 0, 40}]

and this is the result I got

[![enter image description here][1]][1]

As you can see, there is an unexpected visual between $t=30$ and $t=40$. But when I used the identity $e^{-t}=\cosh{t}-\sinh{t}$, everything went fine. This command

Plot[Exp[-t] + Sin[t], {t, 0, 40}]

gives

[![enter image description here][2]][2]

What's going on here? Can anyone reproduce this result? Is this a bug? I'm using WMA 12 64bit on Windows 10. [1]: https://i.sstatic.net/tGAvh.png [2]: https://i.sstatic.net/GusTr.png

Source Link
Sukan
  • 475
  • 3
  • 7
Loading