edited tags
Link
edited body
Source Link
Steve237
  • 1.5k
  • 4
  • 9

I am plotting a 3D graph as you can see:

Plot3D[Sqrt[((x^2 + y^2)/((x*y) + 1))], {x, -20, 20}, {y, -20, 20}]

Then I display the integer values of it for the same range (thanks to members here who helped me with onit on this board here!) like so:

sol = SortBy[{x, y, s} /.Solve[s == Sqrt[((x^2 + y^2)/((x*y) + 1))] && -20 <= x <= 20 && -20 <= y <= 20, {x, y, s}, Integers], Last]

enter image description here

enter image description here

Now if you notice the graph only goes up to a value of 4 max (on the output values - running UP on the left side) whereas the integer solution for that range easily is going up to a value of 20 : {20, 0, 20} . So why is it that the graph is not showing anything larger than 4 here?

Also: for example the value of output of 1,20 is 4.36 but if you look at the graph, it spikes down (right in the middle, lower part of the chart near 0), instead of being at 4.36. What are all those SPIKES exactly on the chart? Why don't they map to some actual values? I wonder they are the imaginary roots?

Can we show values on the graph like local min and max?

How can I make this graph more clear to show all values or in a better readable format?

In addition, can I just plot a 3D graph of ONLY the integer values?

Thanks in Advance! Steve.

I am plotting a 3D graph as you can see:

Plot3D[Sqrt[((x^2 + y^2)/((x*y) + 1))], {x, -20, 20}, {y, -20, 20}]

Then I display the integer values of it for the same range (thanks to members here who helped me with on on this board here!) like so:

sol = SortBy[{x, y, s} /.Solve[s == Sqrt[((x^2 + y^2)/((x*y) + 1))] && -20 <= x <= 20 && -20 <= y <= 20, {x, y, s}, Integers], Last]

enter image description here

enter image description here

Now if you notice the graph only goes up to a value of 4 max (on the output values - running UP on the left side) whereas the integer solution for that range easily is going up to a value of 20 : {20, 0, 20} . So why is it that the graph is not showing anything larger than 4 here?

Also: for example the value of output of 1,20 is 4.36 but if you look at the graph, it spikes down (right in the middle, lower part of the chart near 0), instead of being at 4.36. What are all those SPIKES exactly on the chart? Why don't they map to some actual values? I wonder they are the imaginary roots?

Can we show values on the graph like local min and max?

How can I make this graph more clear to show all values or in a better readable format?

In addition, can I just plot a 3D graph of ONLY the integer values?

Thanks in Advance! Steve.
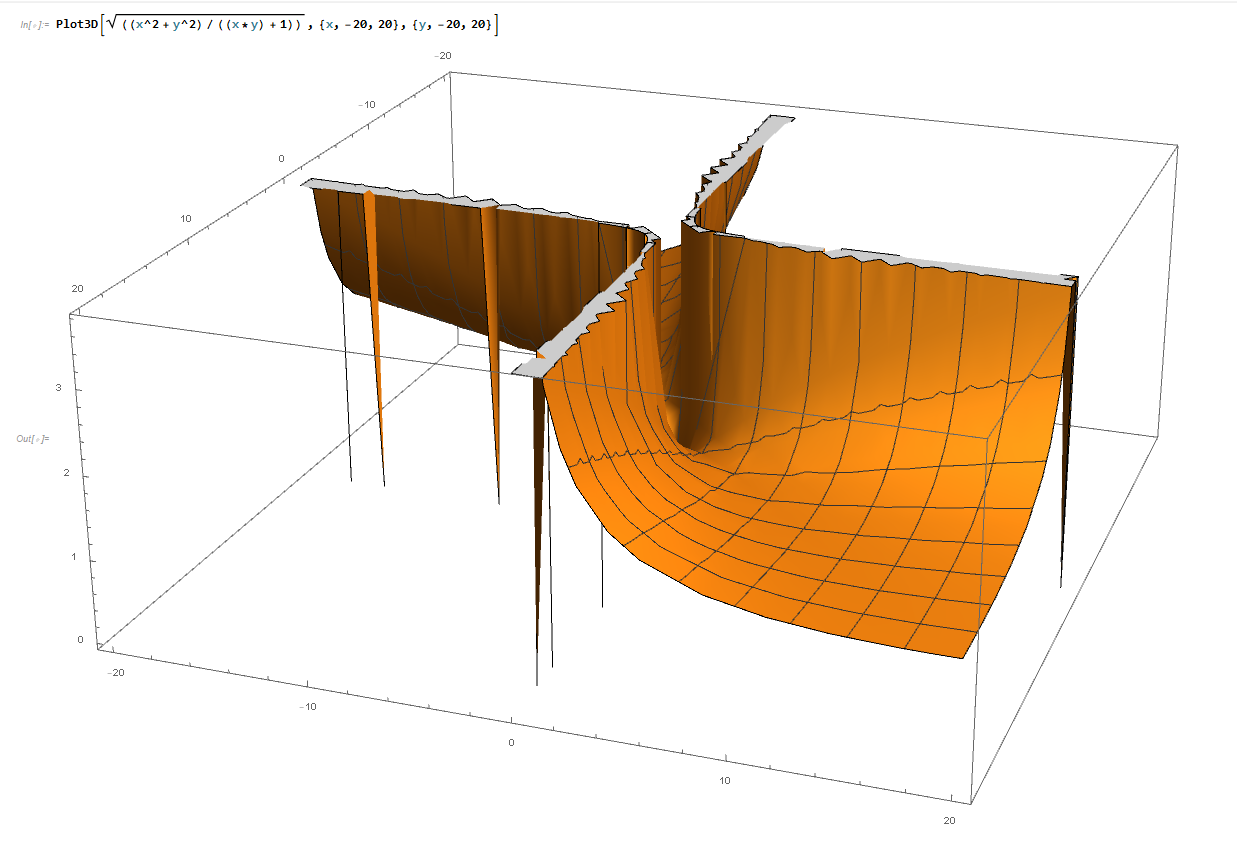
I am plotting a 3D graph as you can see:

Plot3D[Sqrt[((x^2 + y^2)/((x*y) + 1))], {x, -20, 20}, {y, -20, 20}]

Then I display the integer values of it for the same range (thanks to members here who helped me with it on this board here!) like so:

sol = SortBy[{x, y, s} /.Solve[s == Sqrt[((x^2 + y^2)/((x*y) + 1))] && -20 <= x <= 20 && -20 <= y <= 20, {x, y, s}, Integers], Last]

enter image description here

enter image description here

Now if you notice the graph only goes up to a value of 4 max (on the output values - running UP on the left side) whereas the integer solution for that range easily is going up to a value of 20 : {20, 0, 20} . So why is it that the graph is not showing anything larger than 4 here?

Also: for example the value of output of 1,20 is 4.36 but if you look at the graph, it spikes down (right in the middle, lower part of the chart near 0), instead of being at 4.36. What are all those SPIKES exactly on the chart? Why don't they map to some actual values? I wonder they are the imaginary roots?

Can we show values on the graph like local min and max?

How can I make this graph more clear to show all values or in a better readable format?

In addition, can I just plot a 3D graph of ONLY the integer values?

Thanks in Advance! Steve.

Source Link
Steve237
  • 1.5k
  • 4
  • 9

3D plot Versus actual values

I am plotting a 3D graph as you can see:

Plot3D[Sqrt[((x^2 + y^2)/((x*y) + 1))], {x, -20, 20}, {y, -20, 20}]

Then I display the integer values of it for the same range (thanks to members here who helped me with on on this board here!) like so:

sol = SortBy[{x, y, s} /.Solve[s == Sqrt[((x^2 + y^2)/((x*y) + 1))] && -20 <= x <= 20 && -20 <= y <= 20, {x, y, s}, Integers], Last]

enter image description here

enter image description here

Now if you notice the graph only goes up to a value of 4 max (on the output values - running UP on the left side) whereas the integer solution for that range easily is going up to a value of 20 : {20, 0, 20} . So why is it that the graph is not showing anything larger than 4 here?

Also: for example the value of output of 1,20 is 4.36 but if you look at the graph, it spikes down (right in the middle, lower part of the chart near 0), instead of being at 4.36. What are all those SPIKES exactly on the chart? Why don't they map to some actual values? I wonder they are the imaginary roots?

Can we show values on the graph like local min and max?

How can I make this graph more clear to show all values or in a better readable format?

In addition, can I just plot a 3D graph of ONLY the integer values?

Thanks in Advance! Steve.