This is an extended comment.
IfI know you believe that the software is misbehaving. However, then please show anyour example using SeedRandom so thatdoes not show a poor fit to the example is repeatabledensity. See below.
SeedRandom[12345];SeedRandom[123456];
x = RandomVariate[WeibullDistribution[84RandomVariate[WeibullDistribution[148.2383, 366653.91, -494781.9]061], 10000];
sol = FindDistributionParameters[x, WeibullDistribution[α, β, μ]]
(* {α -> 67668.9517203, β -> 2942970.6661, μ -> -4223098.73853} *)

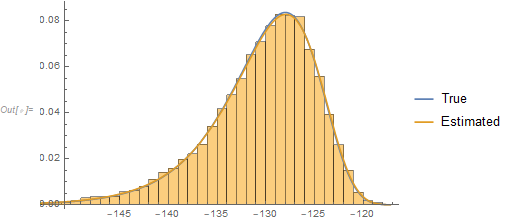
Show[Histogram[x, Automatic, "PDF"],
  Plot[{PDF[WeibullDistribution[84PDF[WeibullDistribution[148.2383, 366653.91, -494781.9]061], z],
    PDF[WeibullDistribution[α, β, μ] /. sol, z]},
    {z, Min[x], Max[x]}, PlotLegends -> {"True", "Estimated"}]]
Notice that one can't tell the true from the estimated density.
Now, you say, what about the estimates of the parameters being "far" from the true values? (I'll deal with that after breakfast.)


