added 1468 characters in body
Source Link
Alex Trounev
  • 48.8k
  • 3
  • 51
  • 115

We can use boundary conditions twice, then there are no warnings

ClearAll[u, x, t, a, b, c, w, n];

c = 1;
n = 1;
a = 1;
b = 1;
w = 1;
f[t_] := If[t < 10^-6, 0, 1];
pde = {D[v[t, x], t] - c*D[u[t, x], x, x] - n*D[v[t, x], x, x] == 0, 
   v[t, x] == D[u[t, x], t]};
ics = {u[0, x] == 0, v[0, x] == 0};
bcs = {(D[u[t, x], x] /. x -> 0) == (a*Sin[w*t] - b*Cos[w*t]) f[
      t], (D[u[t, x], x] /. x -> 1) == a*Sin[w*t] - b*Cos[w*t] f[t]};
bcs1 = {(D[v[t, x], x] /. x -> 0) == 
    w (a*Cos[w*t] + b*Sin[w*t]) f[t], (D[v[t, x], x] /. x -> 1) == 
    w (a*Cos[w*t] + b*Sin[w*t]) f[t]};

{U, V} = NDSolveValue[{pde, ics, bcs, bcs1}, {u, v}, {x, 0, 1}, {t, 0,
     10}, Method -> {"IndexReduction" -> Automatic, 
     "EquationSimplification" -> "Residual", 
     "PDEDiscretization" -> {"MethodOfLines", 
       "SpatialDiscretization" -> {"TensorProductGrid", 
         "MinPoints" -> 141, "MaxPoints" -> 141, 
         "DifferenceOrder" -> 2}}}];

{DensityPlot[U[t, x], {x, 0, 1}, {t, 0, 10}, 
  ColorFunction -> "Rainbow", PlotLegends -> Automatic, 
  FrameLabel -> Automatic, PlotLabel -> "u"], 
 DensityPlot[V[t, x], {x, 0, 1}, {t, 0, 10}, 
  ColorFunction -> "Rainbow", PlotLegends -> Automatic, 
  FrameLabel -> Automatic, PlotLabel -> "v"]}

Figure 2

We can use boundary conditions twice, then there are no warnings

ClearAll[u, x, t, a, b, c, w, n];

c = 1;
n = 1;
a = 1;
b = 1;
w = 1;
f[t_] := If[t < 10^-6, 0, 1];
pde = {D[v[t, x], t] - c*D[u[t, x], x, x] - n*D[v[t, x], x, x] == 0, 
   v[t, x] == D[u[t, x], t]};
ics = {u[0, x] == 0, v[0, x] == 0};
bcs = {(D[u[t, x], x] /. x -> 0) == (a*Sin[w*t] - b*Cos[w*t]) f[
      t], (D[u[t, x], x] /. x -> 1) == a*Sin[w*t] - b*Cos[w*t] f[t]};
bcs1 = {(D[v[t, x], x] /. x -> 0) == 
    w (a*Cos[w*t] + b*Sin[w*t]) f[t], (D[v[t, x], x] /. x -> 1) == 
    w (a*Cos[w*t] + b*Sin[w*t]) f[t]};

{U, V} = NDSolveValue[{pde, ics, bcs, bcs1}, {u, v}, {x, 0, 1}, {t, 0,
     10}, Method -> {"IndexReduction" -> Automatic, 
     "EquationSimplification" -> "Residual", 
     "PDEDiscretization" -> {"MethodOfLines", 
       "SpatialDiscretization" -> {"TensorProductGrid", 
         "MinPoints" -> 141, "MaxPoints" -> 141, 
         "DifferenceOrder" -> 2}}}];

{DensityPlot[U[t, x], {x, 0, 1}, {t, 0, 10}, 
  ColorFunction -> "Rainbow", PlotLegends -> Automatic, 
  FrameLabel -> Automatic, PlotLabel -> "u"], 
 DensityPlot[V[t, x], {x, 0, 1}, {t, 0, 10}, 
  ColorFunction -> "Rainbow", PlotLegends -> Automatic, 
  FrameLabel -> Automatic, PlotLabel -> "v"]}
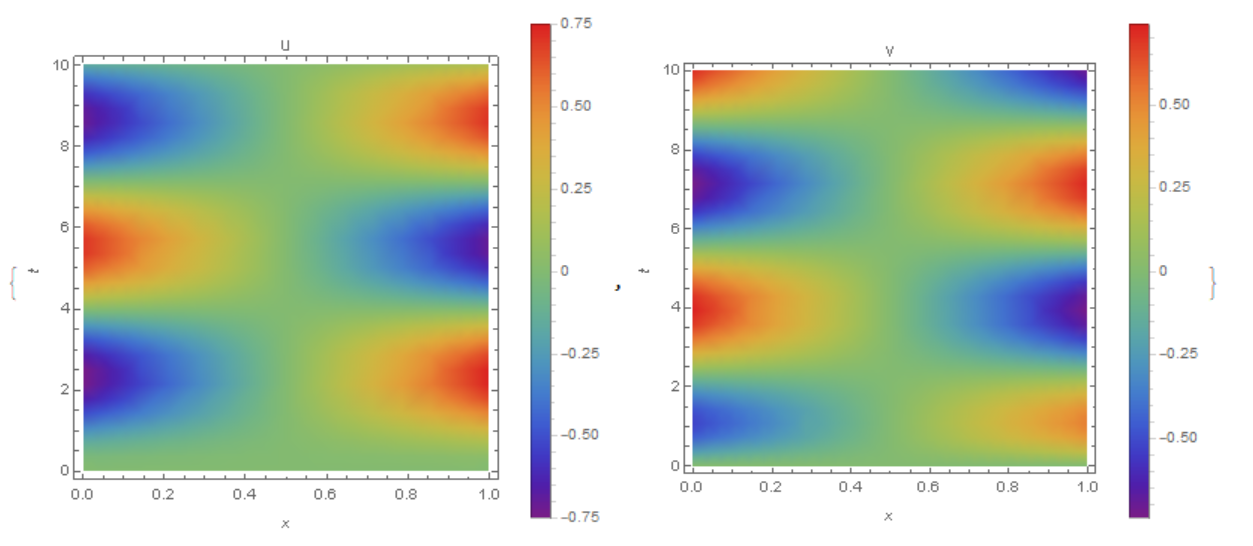
Figure 2

Source Link
Alex Trounev
  • 48.8k
  • 3
  • 51
  • 115

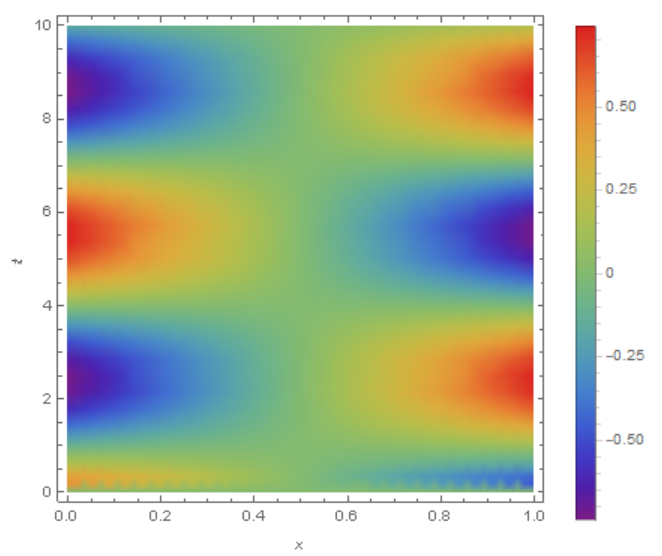
It is necessary to divide the equation into two (second order), add the initial data and boundary conditions. Here is the code without adding boundary conditions

ClearAll[u, x, t, a, b, c, w, n];

c = 1;
n = 1;
a = 1;
b = 1;
w = 1;

pde = {D[u[t, x], t, t] - c*D[u[t, x], x, x] - n*D[v[t, x], t] == 0, 
   v[t, x] == D[u[t, x], x, x]};
ics = {u[0, x] == 0, v[0, x] == 0, Derivative[1, 0][u][0, x] == 0};
bcs = {(D[u[t, x], x] /. x -> 0) == 
    If[t <= 10^-6, 0, 
     a*Sin[w*t] - b*Cos[w*t]], (D[u[t, x], x] /. x -> 1) == 
    If[t <= 10^-6, 0, a*Sin[w*t] - b*Cos[w*t]]};

{U, V} = NDSolveValue[{pde, ics, bcs}, {u, v}, {x, 0, 1}, {t, 0, 10}, 
  Method -> {"IndexReduction" -> Automatic, 
    "EquationSimplification" -> "Residual", 
    "PDEDiscretization" -> {"MethodOfLines", 
      "SpatialDiscretization" -> {"TensorProductGrid", 
        "MinPoints" -> 141, "MaxPoints" -> 141, 
        "DifferenceOrder" -> 2}}}]

DensityPlot[U[t, x], {x, 0, 1}, {t, 0, 10}, 
 ColorFunction -> "Rainbow", PlotLegends -> Automatic, 
 FrameLabel -> Automatic]

Figure 1