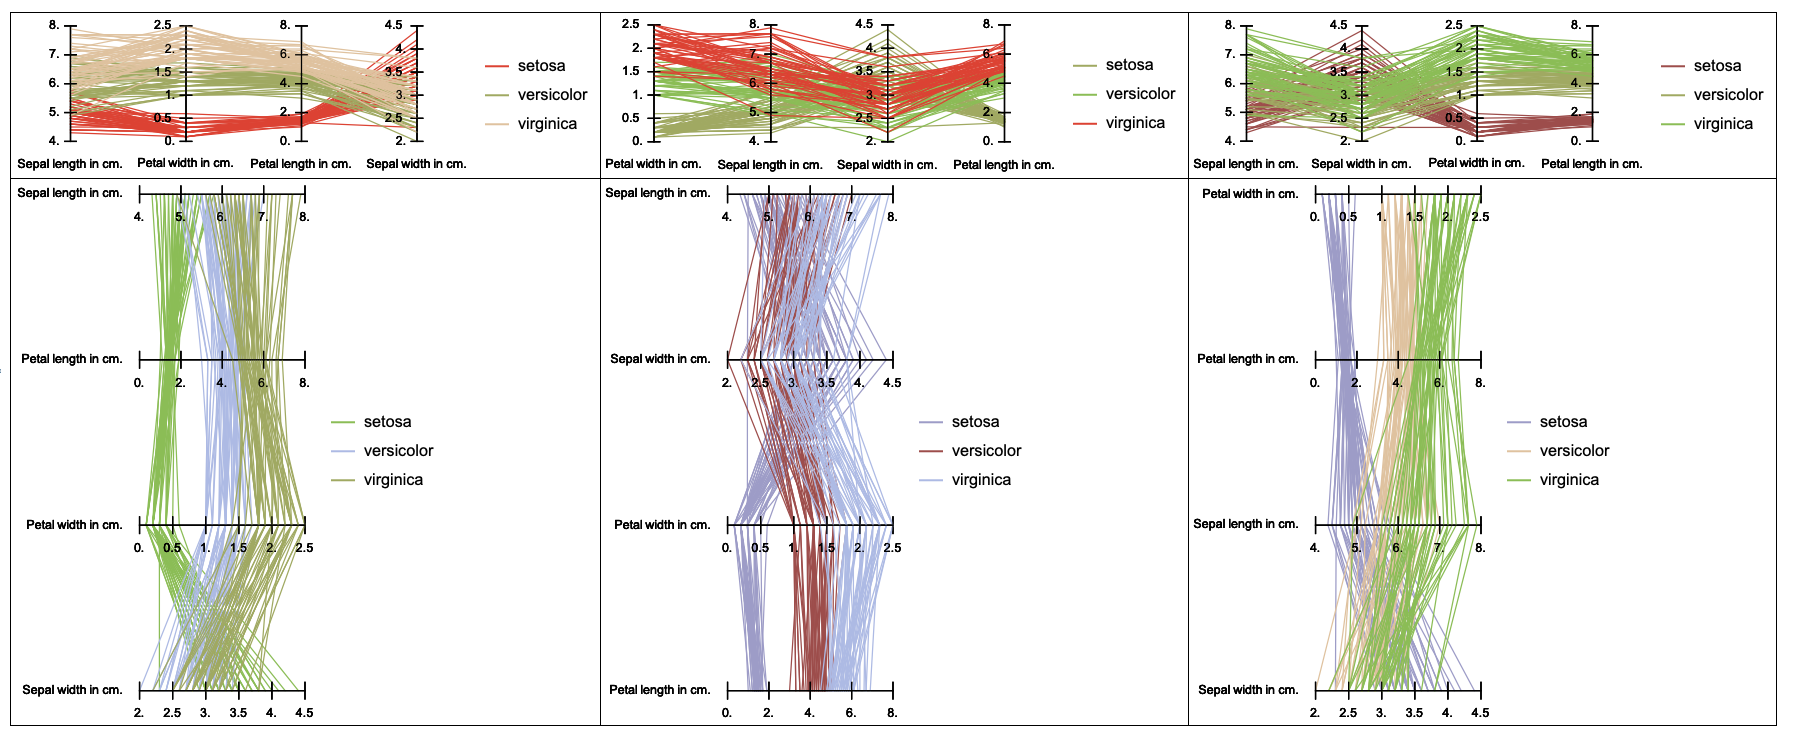
I implemented the package "ParallelCoordinatesPlot.m" for doing this kind of plots and put it in GitHub. I plan to improve it some more. It is especially interesting to have automatic selection of the axes order that produces most discernible results.
Import["https://raw.githubusercontent.com/antononcube/MathematicaForPrediction/master/Misc/ParallelCoordinatesPlot.m"]

data = ExampleData[{"Statistics", "FisherIris"}];
colNames = ExampleData[{"Statistics", "FisherIris"}, "ColumnDescriptions"];

aData = GroupBy[data, #[[-1]] &, #[[All, 1 ;; -2]] &];

grs = Table[ParallelCoordinatesPlot[aData, Most[colNames], "Colors" -> Random, "AxesOrder" -> Random, Direction -> dir, ImageSize -> Medium], {dir, {"Horizontal", "Vertical"}}, {m, 3}];
Grid[grs, Alignment -> Left, Dividers -> All]

First answer
Below is given a function definition to do this. It can be improved and "productized" some more, especially with legend's colors specification. (Currently random colors are picked from a hard coded color scheme.)