Tweeted twitter.com/StackMma/status/1164779440628310016
Became Hot Network Question
edited title
Link
user67023
user67023

Visualizing twoRiemann surface (two branches) of logarithm

added 17 characters in body
Source Link
user67023
user67023

I'm trying to plot two branches of the complex multi-valued function: (In a previous post - linked above-, Mathematica findsfound the branch cut of the following function between -1 and 0)

$1-z\ln[(1+z)/z]$.

So, forto plot the real parts of the two sheets, Iwe have:

Plot3D[{Re[1 - (x + I y) (Log[1 + x + I y] - Log[x + I y])], 
Re[1 - (x + I y) (Log[1 + x + I y] - Log[x + I y] - 
I 2 Pi)]}, {x, -2, 2}, {y, -3, 3}, BoxRatios -> {1, 1, 1.5}, 
PlotRange -> All, PlotPoints -> 50, Mesh -> 30, 
MeshFunctions -> {Im[Log[#1 + I #2]] &, Re[Log[#1 + I #2]] &}, 
ImageSize -> Large, ColorFunction -> mycolor]

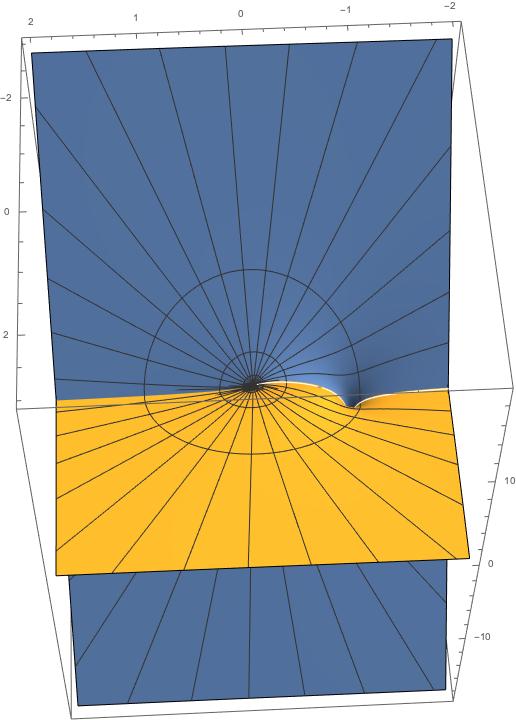
which as expected the two sheets are connected through the branch cut between -1 and 0 on the x-axis:

enter image description here

However, the pictures shows another branch cut between -2 and -1. How come?

I'm trying to plot two branches of the complex multi-valued function: (In a previous post, Mathematica finds the branch cut of the following function between -1 and 0)

$1-z\ln[(1+z)/z]$.

So, for the real parts of the two sheets, I have:

Plot3D[{Re[1 - (x + I y) (Log[1 + x + I y] - Log[x + I y])], 
Re[1 - (x + I y) (Log[1 + x + I y] - Log[x + I y] - 
I 2 Pi)]}, {x, -2, 2}, {y, -3, 3}, BoxRatios -> {1, 1, 1.5}, 
PlotRange -> All, PlotPoints -> 50, Mesh -> 30, 
MeshFunctions -> {Im[Log[#1 + I #2]] &, Re[Log[#1 + I #2]] &}, 
ImageSize -> Large, ColorFunction -> mycolor]

which as expected the two sheets are connected through the branch cut between -1 and 0 on the x-axis:

enter image description here

However, the pictures shows another branch cut between -2 and -1. How come?
I'm trying to plot two branches of the complex multi-valued function: (In a previous post - linked above-, Mathematica found the branch cut of the following function between -1 and 0)

$1-z\ln[(1+z)/z]$.

So, to plot the real parts of the two sheets, we have:

Plot3D[{Re[1 - (x + I y) (Log[1 + x + I y] - Log[x + I y])], 
Re[1 - (x + I y) (Log[1 + x + I y] - Log[x + I y] - 
I 2 Pi)]}, {x, -2, 2}, {y, -3, 3}, BoxRatios -> {1, 1, 1.5}, 
PlotRange -> All, PlotPoints -> 50, Mesh -> 30, 
MeshFunctions -> {Im[Log[#1 + I #2]] &, Re[Log[#1 + I #2]] &}, 
ImageSize -> Large, ColorFunction -> mycolor]

which as expected the two sheets are connected through the branch cut between -1 and 0 on the x-axis:

enter image description here

However, the pictures shows another branch cut between -2 and -1. How come?

added 100 characters in body
Source Link
user67023
user67023

I'm trying to plot two branches of the complex multi-valued function: (In a previous posta previous post, Mathematica finds the branch cut of the following function between -1 and 0)

$1-z\ln[(1+z)/z]$.

So, for the real parts of the two sheets, I have:

Plot3D[{Re[1 - (x + I y) (Log[1 + x + I y] - Log[x + I y])], 
Re[1 - (x + I y) (Log[1 + x + I y] - Log[x + I y] - 
I 2 Pi)]}, {x, -2, 2}, {y, -3, 3}, BoxRatios -> {1, 1, 1.5}, 
PlotRange -> All, PlotPoints -> 50, Mesh -> 30, 
MeshFunctions -> {Im[Log[#1 + I #2]] &, Re[Log[#1 + I #2]] &}, 
ImageSize -> Large, ColorFunction -> mycolor]

which as expected the two sheets are connected through the branch cut between -1 and 0 on the x-axis:

enter image description here

However, the pictures shows another branch cut between -2 and -1. How come?

I'm trying to plot two branches of the complex multi-valued function: (In a previous post, Mathematica finds the branch cut of the following function between -1 and 0)

$1-z\ln[(1+z)/z]$.

So, for the real parts of the two sheets, I have:

Plot3D[{Re[1 - (x + I y) (Log[1 + x + I y] - Log[x + I y])], 
Re[1 - (x + I y) (Log[1 + x + I y] - Log[x + I y] - 
I 2 Pi)]}, {x, -2, 2}, {y, -3, 3}, BoxRatios -> {1, 1, 1.5}, 
PlotRange -> All, PlotPoints -> 50, Mesh -> 30, 
MeshFunctions -> {Im[Log[#1 + I #2]] &, Re[Log[#1 + I #2]] &}, 
ImageSize -> Large, ColorFunction -> mycolor]

which as expected the two sheets are connected through the branch cut between -1 and 0 on the x-axis:

enter image description here

However, the pictures shows another branch cut between -2 and -1. How come?

added 98 characters in body
Source Link
user67023
user67023
Loading
Source Link
user67023
user67023
Loading