replaced http://mathematica.stackexchange.com/ with https://mathematica.stackexchange.com/
Source Link

What is the best way to clip a graphic to a certain region?

Here's a very simple implementation to show what I mean:

Show[
 CountryData["World", "Shape"],
 Graphics[{White, 
   FilledCurve[{{Line[{{-200, -100}, {200, -100}, {200, 100}, {-200, 
         100}}]}, {Line[{{-10.181224213835492, 65.15571149065886}, 
              {-4.290845998237188, 
         79.14535975270482}, {14.116585925507536, 
                63.683116936759234}, {16.32547775635689, 
         43.80309045911497}, 
              {-0.6093596134882375, 
         35.70382041266731}, {-16.071602429433796, 
                40.85790135131583}, {-13.126413321634658, 
         57.79273872116096}}]}}]}],
 PlotRange -> {{-18, 18}, {35, 82}}, Background -> LightBlue
 ]
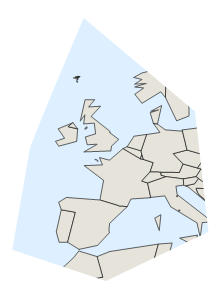
Mathematica graphics

My aim is to be able to clip arbitrary vector graphics to an arbitrary vector region. The region can be anything, and can have curved boundaries (but approximation with line segments is okay).

The problem with the approach I showed here (i.e. simply overlaying a rectangle with a hole in it) is that it is cumbersome and it does not allow arbitrary layering of objects: imagine that I need this clipped graphic to be in the foreground and cover parts of the background objects.

Note: It is possible to clip raster graphics using Texture, as shown herehere. This question is about clipping arbitrary vector graphics. If it is not possible to do this in the current version of Mathematica, I accept that.

What is the best way to clip a graphic to a certain region?

Here's a very simple implementation to show what I mean:

Show[
 CountryData["World", "Shape"],
 Graphics[{White, 
   FilledCurve[{{Line[{{-200, -100}, {200, -100}, {200, 100}, {-200, 
         100}}]}, {Line[{{-10.181224213835492, 65.15571149065886}, 
              {-4.290845998237188, 
         79.14535975270482}, {14.116585925507536, 
                63.683116936759234}, {16.32547775635689, 
         43.80309045911497}, 
              {-0.6093596134882375, 
         35.70382041266731}, {-16.071602429433796, 
                40.85790135131583}, {-13.126413321634658, 
         57.79273872116096}}]}}]}],
 PlotRange -> {{-18, 18}, {35, 82}}, Background -> LightBlue
 ]

Mathematica graphics

My aim is to be able to clip arbitrary vector graphics to an arbitrary vector region. The region can be anything, and can have curved boundaries (but approximation with line segments is okay).

The problem with the approach I showed here (i.e. simply overlaying a rectangle with a hole in it) is that it is cumbersome and it does not allow arbitrary layering of objects: imagine that I need this clipped graphic to be in the foreground and cover parts of the background objects.

Note: It is possible to clip raster graphics using Texture, as shown here. This question is about clipping arbitrary vector graphics. If it is not possible to do this in the current version of Mathematica, I accept that.

deleted 229 characters in body
Source Link
Szabolcs
  • 236.5k
  • 31
  • 641
  • 1.3k

What is the best way to clip a graphic to a certain region?

Here's a very simple implementation to show what I mean:

Show[
 CountryData["World", "Shape"],
 Graphics[{White, 
   FilledCurve[{{Line[{{-200, -100}, {200, -100}, {200, 100}, {-200, 
         100}}]}, {Line[{{-10.181224213835492, 65.15571149065886}, 
              {-4.290845998237188, 
         79.14535975270482}, {14.116585925507536, 
                63.683116936759234}, {16.32547775635689, 
         43.80309045911497}, 
              {-0.6093596134882375, 
         35.70382041266731}, {-16.071602429433796, 
                40.85790135131583}, {-13.126413321634658, 
         57.79273872116096}}]}}]}],
 PlotRange -> {{-18, 18}, {35, 82}}, Background -> LightBlue
 ]

Mathematica graphics

My aim is to be able to clip arbitrary vector graphics to an arbitrary vector region. The region can be anything, and can have curved boundaries (but approximation with line segments is okay).

The problem with the approach I showed here (i.e. simply overlaying a rectangle with a hole in it) is that it is cumbersome and it does not allow arbitrary layering of objects: imagine that I need this clipped graphic to be in the foreground and cover parts of the background objects.

Note: It is possible to clip raster graphics using Texture, as shown here. This question is about clipping arbitrary vector graphics. If it is not possible to do this in the current version(I suppose 7.0 at that time?) of Mathematica, I accept that.

Edit Note: I consider this problem quite prevailing as I met this problem today too. And after so many version updates, I think maybe there's a way to solve this by region-related functions or so?

What is the best way to clip a graphic to a certain region?

Here's a very simple implementation to show what I mean:

Show[
 CountryData["World", "Shape"],
 Graphics[{White, 
   FilledCurve[{{Line[{{-200, -100}, {200, -100}, {200, 100}, {-200, 
         100}}]}, {Line[{{-10.181224213835492, 65.15571149065886}, 
              {-4.290845998237188, 
         79.14535975270482}, {14.116585925507536, 
                63.683116936759234}, {16.32547775635689, 
         43.80309045911497}, 
              {-0.6093596134882375, 
         35.70382041266731}, {-16.071602429433796, 
                40.85790135131583}, {-13.126413321634658, 
         57.79273872116096}}]}}]}],
 PlotRange -> {{-18, 18}, {35, 82}}, Background -> LightBlue
 ]

Mathematica graphics

My aim is to be able to clip arbitrary vector graphics to an arbitrary vector region. The region can be anything, and can have curved boundaries (but approximation with line segments is okay).

The problem with the approach I showed here (i.e. simply overlaying a rectangle with a hole in it) is that it is cumbersome and it does not allow arbitrary layering of objects: imagine that I need this clipped graphic to be in the foreground and cover parts of the background objects.

Note: It is possible to clip raster graphics using Texture, as shown here. This question is about clipping arbitrary vector graphics. If it is not possible to do this in the current version of Mathematica, I accept that.

poke it to the top again and make a bit alternation.
Source Link
Wjx
  • 9.7k
  • 1
  • 34
  • 70

What is the best way to clip a graphic to a certain region?

Here's a very simple implementation to show what I mean:

Show[
 CountryData["World", "Shape"],
 Graphics[{White, 
   FilledCurve[{{Line[{{-200, -100}, {200, -100}, {200, 100}, {-200, 
         100}}]}, {Line[{{-10.181224213835492, 65.15571149065886}, 
              {-4.290845998237188, 
         79.14535975270482}, {14.116585925507536, 
                63.683116936759234}, {16.32547775635689, 
         43.80309045911497}, 
              {-0.6093596134882375, 
         35.70382041266731}, {-16.071602429433796, 
                40.85790135131583}, {-13.126413321634658, 
         57.79273872116096}}]}}]}],
 PlotRange -> {{-18, 18}, {35, 82}}, Background -> LightBlue
 ]

Mathematica graphics

My aim is to be able to clip arbitrary vector graphics to an arbitrary vector region. TheThe region can be anything, and can have curved boundaries (but approximation with line segments is okay).

The problem with the approach I showed here (i.e. simply overlaying a rectangle with a hole in it) is that it is cumbersome and it does not allow arbitrary layering of objects: imagine that I need this clipped graphic to be in the foreground and cover parts of the background objects.

Note: It is possible to clip raster graphics using Texture, as shown here. This question is about clipping arbitrary vector graphics. If it is not possible to do this in the current version(I suppose 7.0 at that time?) of Mathematica, I accept that.

Edit Note: I consider this problem quite prevailing as I met this problem today too. And after so many version updates, I think maybe there's a way to solve this by region-related functions or so?

What is the best way to clip a graphic to a certain region?

Here's a very simple implementation to show what I mean:

Show[
 CountryData["World", "Shape"],
 Graphics[{White, 
   FilledCurve[{{Line[{{-200, -100}, {200, -100}, {200, 100}, {-200, 
         100}}]}, {Line[{{-10.181224213835492, 65.15571149065886}, 
              {-4.290845998237188, 
         79.14535975270482}, {14.116585925507536, 
                63.683116936759234}, {16.32547775635689, 
         43.80309045911497}, 
              {-0.6093596134882375, 
         35.70382041266731}, {-16.071602429433796, 
                40.85790135131583}, {-13.126413321634658, 
         57.79273872116096}}]}}]}],
 PlotRange -> {{-18, 18}, {35, 82}}, Background -> LightBlue
 ]

Mathematica graphics

My aim is to be able to clip arbitrary vector graphics to an arbitrary region. The region can be anything, and can have curved boundaries (but approximation with line segments is okay).

The problem with the approach I showed here (i.e. simply overlaying a rectangle with a hole in it) is that it is cumbersome and it does not allow arbitrary layering of objects: imagine that I need this clipped graphic to be in the foreground and cover parts of the background objects.

Note: It is possible to clip raster graphics using Texture, as shown here. This question is about clipping arbitrary vector graphics. If it is not possible to do this in the current version of Mathematica, I accept that.

What is the best way to clip a graphic to a certain region?

Here's a very simple implementation to show what I mean:

Show[
 CountryData["World", "Shape"],
 Graphics[{White, 
   FilledCurve[{{Line[{{-200, -100}, {200, -100}, {200, 100}, {-200, 
         100}}]}, {Line[{{-10.181224213835492, 65.15571149065886}, 
              {-4.290845998237188, 
         79.14535975270482}, {14.116585925507536, 
                63.683116936759234}, {16.32547775635689, 
         43.80309045911497}, 
              {-0.6093596134882375, 
         35.70382041266731}, {-16.071602429433796, 
                40.85790135131583}, {-13.126413321634658, 
         57.79273872116096}}]}}]}],
 PlotRange -> {{-18, 18}, {35, 82}}, Background -> LightBlue
 ]

Mathematica graphics

My aim is to be able to clip arbitrary vector graphics to an arbitrary vector region. The region can be anything, and can have curved boundaries (but approximation with line segments is okay).

The problem with the approach I showed here (i.e. simply overlaying a rectangle with a hole in it) is that it is cumbersome and it does not allow arbitrary layering of objects: imagine that I need this clipped graphic to be in the foreground and cover parts of the background objects.

Note: It is possible to clip raster graphics using Texture, as shown here. This question is about clipping arbitrary vector graphics. If it is not possible to do this in the current version(I suppose 7.0 at that time?) of Mathematica, I accept that.

Edit Note: I consider this problem quite prevailing as I met this problem today too. And after so many version updates, I think maybe there's a way to solve this by region-related functions or so?

added 55 characters in body
Source Link
Szabolcs
  • 236.5k
  • 31
  • 641
  • 1.3k
Loading
Tweeted twitter.com/#!/StackMma/status/171293264765403137
added 295 characters in body
Source Link
Szabolcs
  • 236.5k
  • 31
  • 641
  • 1.3k
Loading
Source Link
Szabolcs
  • 236.5k
  • 31
  • 641
  • 1.3k
Loading