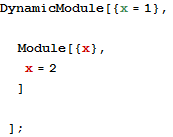
I am adding a Module into the Initialization section ofinside DynamicModule. here is an example (thanks to @rm-rf for this simple example)
DynamicModule[{x = 1}, Module[{x}, x = 2] ];
This Module has a local symbol called maxmx which happens also to be the name of another local symbol in the enclosing DynamicModule.
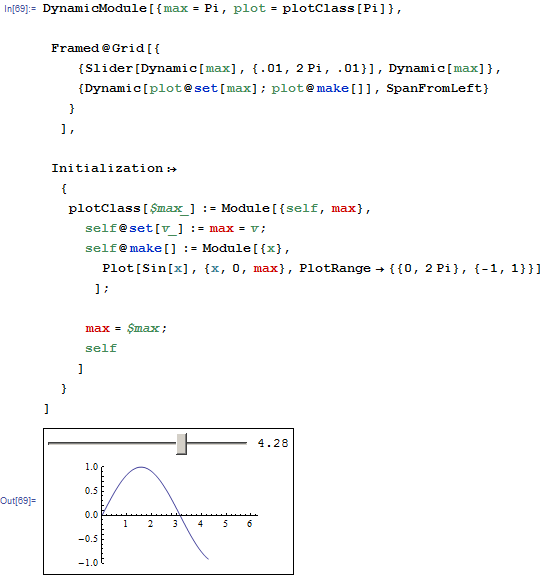
Yet, the front end is making all occurrences of maxx as red inside the Module in the Initialization section. Here is a screen shot
I am always confused by Mathematica's lexical and dynamic scope of symbols, as I really do not understand it well (may be some expert should one day write a document that just describes this part of Mathematica, there are bits of pieces on this over the net, but seems there should be one official document on this).
The question is: Why would local symbol to one Module conflict with local symbol of the enclosing DynamcModule? Yet, the code runs with no problem. So, could this just be that the FE` is confused? or Am I doing something wrong?
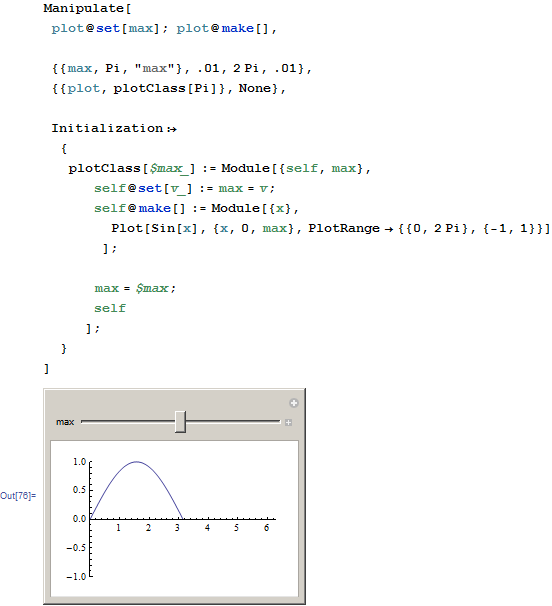
The same example, when used with Manipulate, instead of DynamicModule works just as well, but with no red color added to the same local symbol.
I show the example in DynamicModule and the same example in Manipulate.
I'd like to understand why in one case the symbol is red in DynamicModule but not red in Manipulate.
DynamicModule example
DynamicModule[{max = Pi, plot = plotClass[Pi]},

 Framed@Grid[{
    {Slider[Dynamic[max], {.01, 2 Pi, .01}], Dynamic[max]},
    {Dynamic[plot@set[max]; plot@make[]], SpanFromLeft}
    }
   ],

 Initialization :>
  {
   plotClass[$max_] := Module[{self, max},
     self@set[v_] := max = v;
     self@make[] := Module[{x},
       Plot[Sin[x], {x, 0, max}, PlotRange -> {{0, 2 Pi}, {-1, 1}}]
       ];

     max = $max;
     self
     ]
   }
 ]
screen shot

same example in Manipulate
(you might have to hit shift-enter 2 times to fully evaluate)
Manipulate[
 plot@set[max]; plot@make[],

 {{max, Pi, "max"}, .01, 2 Pi, .01},
 {{plot, plotClass[Pi]}, None},

 Initialization :>
  {
   plotClass[$max_] := Module[{self, max},
      self@set[v_] := max = v;
      self@make[] := Module[{x},
        Plot[Sin[x], {x, 0, max}, PlotRange -> {{0, 2 Pi}, {-1, 1}}]
        ];

      max = $max;
      self
      ];
   }
 ]
screen shot


