replaced http://mathematica.stackexchange.com/ with https://mathematica.stackexchange.com/
Source Link
f = Interpolation[l3= (Last /@ Sort /@ GatherBy[l[[All, 1 ;; 2]], #[[1]] &])]
ListContourPlot[l, RegionFunction -> (#2 < f[#1] &)]
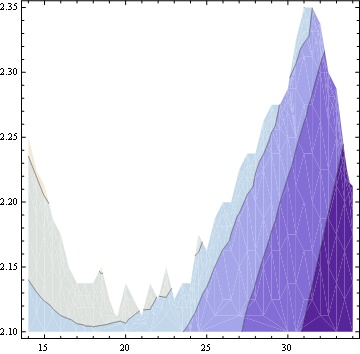
Mathematica graphics

Edit

If you want a smoother curve, you could use for example whuber's method herewhuber's method here for getting something similar to an "envolvent" curve:

l4 = {(#[[1]] - 14) 2 + 1, #[[2]]} & /@ l3;
nrow = 32;
i = Image[SparseArray[Flatten[Table[{i, IntegerPart@#1} -> #2, {i, 1, nrow}] & @@@ l4]]] 
                                                                                   // ImageAdjust

Mathematica graphics

{minima, maxima} = Flatten[Position[First[ImageData[#[i]]], 1]] & /@ {MinDetect, MaxDetect};

f1 = Interpolation[N@{(#[[1]] - 1)/2 + 14, #[[2]]} & /@ l4[[maxima]], InterpolationOrder -> 1]

f2[x_] = Max[f[x], f1[x]]

The "envolvent":

Quiet@Show[ListLinePlot@l3, Plot[f2[x], {x, 14, 34}]]
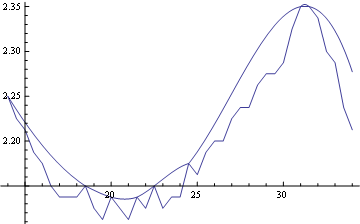
Mathematica graphics

Quiet@ListContourPlot[l, RegionFunction -> (#2 < f2[#1] &)]
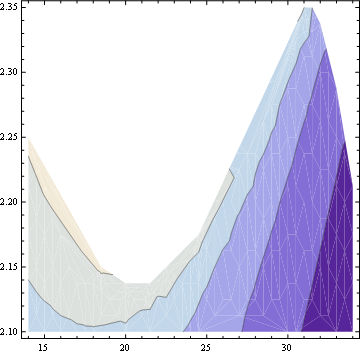
Mathematica graphics

Quiet@ListPlot3D[l, RegionFunction -> (#2 < f2[#1] &), 
                 ColorFunction -> "SouthwestColors", MeshFunctions -> {#3 &}]
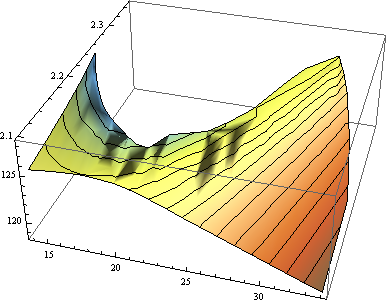
Mathematica graphics

f = Interpolation[l3= (Last /@ Sort /@ GatherBy[l[[All, 1 ;; 2]], #[[1]] &])]
ListContourPlot[l, RegionFunction -> (#2 < f[#1] &)]

Mathematica graphics

Edit

If you want a smoother curve, you could use for example whuber's method here for getting something similar to an "envolvent" curve:

l4 = {(#[[1]] - 14) 2 + 1, #[[2]]} & /@ l3;
nrow = 32;
i = Image[SparseArray[Flatten[Table[{i, IntegerPart@#1} -> #2, {i, 1, nrow}] & @@@ l4]]] 
                                                                                   // ImageAdjust

Mathematica graphics

{minima, maxima} = Flatten[Position[First[ImageData[#[i]]], 1]] & /@ {MinDetect, MaxDetect};

f1 = Interpolation[N@{(#[[1]] - 1)/2 + 14, #[[2]]} & /@ l4[[maxima]], InterpolationOrder -> 1]

f2[x_] = Max[f[x], f1[x]]

The "envolvent":

Quiet@Show[ListLinePlot@l3, Plot[f2[x], {x, 14, 34}]]

Mathematica graphics

Quiet@ListContourPlot[l, RegionFunction -> (#2 < f2[#1] &)]

Mathematica graphics

Quiet@ListPlot3D[l, RegionFunction -> (#2 < f2[#1] &), 
                 ColorFunction -> "SouthwestColors", MeshFunctions -> {#3 &}]

Mathematica graphics

f = Interpolation[l3= (Last /@ Sort /@ GatherBy[l[[All, 1 ;; 2]], #[[1]] &])]
ListContourPlot[l, RegionFunction -> (#2 < f[#1] &)]

Mathematica graphics

Edit

If you want a smoother curve, you could use for example whuber's method here for getting something similar to an "envolvent" curve:

l4 = {(#[[1]] - 14) 2 + 1, #[[2]]} & /@ l3;
nrow = 32;
i = Image[SparseArray[Flatten[Table[{i, IntegerPart@#1} -> #2, {i, 1, nrow}] & @@@ l4]]] 
                                                                                   // ImageAdjust

Mathematica graphics

{minima, maxima} = Flatten[Position[First[ImageData[#[i]]], 1]] & /@ {MinDetect, MaxDetect};

f1 = Interpolation[N@{(#[[1]] - 1)/2 + 14, #[[2]]} & /@ l4[[maxima]], InterpolationOrder -> 1]

f2[x_] = Max[f[x], f1[x]]

The "envolvent":

Quiet@Show[ListLinePlot@l3, Plot[f2[x], {x, 14, 34}]]

Mathematica graphics

Quiet@ListContourPlot[l, RegionFunction -> (#2 < f2[#1] &)]

Mathematica graphics

Quiet@ListPlot3D[l, RegionFunction -> (#2 < f2[#1] &), 
                 ColorFunction -> "SouthwestColors", MeshFunctions -> {#3 &}]

Mathematica graphics

added 150 characters in body
Source Link
Dr. belisarius
  • 116.2k
  • 13
  • 205
  • 456
f = Interpolation[LastInterpolation[l3= (Last /@ Sort /@ GatherBy[l[[All, 1 ;; 2]], #[[1]] &]]&])]
ListContourPlot[l, RegionFunction -> (#2 < f[#1] &)]

Mathematica graphics

Edit

If you want a smoother curve, you could use for example whuber's method here for getting something similar to an "envolvent" curve:

l4 = {(#[[1]] - 14) 2 + 1, #[[2]]} & /@ l3;
nrow = 32;
i = Image[SparseArray[Flatten[Table[{i, IntegerPart@#1} -> #2, {i, 1, nrow}] & @@@ l4]]] 
                                                                                   // ImageAdjust

Mathematica graphics

{minima, maxima} = Flatten[Position[First[ImageData[#[i]]], 1]] & /@ {MinDetect, MaxDetect};

f1 = Interpolation[N@{(#[[1]] - 1)/2 + 14, #[[2]]} & /@ l4[[maxima]], InterpolationOrder -> 1]

f2[x_] = Max[f[x], f1[x]]

The "envolvent":

Quiet@Show[ListLinePlot@l3, Plot[f2[x], {x, 14, 34}]]

Mathematica graphics

Quiet@ListContourPlot[l, RegionFunction -> (#2 < f2[#1] &)]

Mathematica graphics

Quiet@ListPlot3D[l, RegionFunction -> (#2 < f2[#1] &), 
                 ColorFunction -> "SouthwestColors", MeshFunctions -> {#3 &}]

Mathematica graphics

f = Interpolation[Last /@ Sort /@ GatherBy[l[[All, 1 ;; 2]], #[[1]] &]]
ListContourPlot[l, RegionFunction -> (#2 < f[#1] &)]

Mathematica graphics

Edit

If you want a smoother curve, you could use for example whuber's method here for getting something similar to an "envolvent" curve:

l4 = {(#[[1]] - 14) 2 + 1, #[[2]]} & /@ l3;
nrow = 32;
i = Image[SparseArray[Flatten[Table[{i, IntegerPart@#1} -> #2, {i, 1, nrow}] & @@@ l4]]] 
                                                                                   // ImageAdjust

Mathematica graphics

{minima, maxima} = Flatten[Position[First[ImageData[#[i]]], 1]] & /@ {MinDetect, MaxDetect};

f1 = Interpolation[N@{(#[[1]] - 1)/2 + 14, #[[2]]} & /@ l4[[maxima]], InterpolationOrder -> 1]

f2[x_] = Max[f[x], f1[x]]

Quiet@ListContourPlot[l, RegionFunction -> (#2 < f2[#1] &)]

Mathematica graphics

Quiet@ListPlot3D[l, RegionFunction -> (#2 < f2[#1] &), 
                 ColorFunction -> "SouthwestColors", MeshFunctions -> {#3 &}]

Mathematica graphics

f = Interpolation[l3= (Last /@ Sort /@ GatherBy[l[[All, 1 ;; 2]], #[[1]] &])]
ListContourPlot[l, RegionFunction -> (#2 < f[#1] &)]

Mathematica graphics

Edit

If you want a smoother curve, you could use for example whuber's method here for getting something similar to an "envolvent" curve:

l4 = {(#[[1]] - 14) 2 + 1, #[[2]]} & /@ l3;
nrow = 32;
i = Image[SparseArray[Flatten[Table[{i, IntegerPart@#1} -> #2, {i, 1, nrow}] & @@@ l4]]] 
                                                                                   // ImageAdjust

Mathematica graphics

{minima, maxima} = Flatten[Position[First[ImageData[#[i]]], 1]] & /@ {MinDetect, MaxDetect};

f1 = Interpolation[N@{(#[[1]] - 1)/2 + 14, #[[2]]} & /@ l4[[maxima]], InterpolationOrder -> 1]

f2[x_] = Max[f[x], f1[x]]

The "envolvent":

Quiet@Show[ListLinePlot@l3, Plot[f2[x], {x, 14, 34}]]

Mathematica graphics

Quiet@ListContourPlot[l, RegionFunction -> (#2 < f2[#1] &)]

Mathematica graphics

Quiet@ListPlot3D[l, RegionFunction -> (#2 < f2[#1] &), 
                 ColorFunction -> "SouthwestColors", MeshFunctions -> {#3 &}]

Mathematica graphics

added 211 characters in body
Source Link
Dr. belisarius
  • 116.2k
  • 13
  • 205
  • 456
f = Interpolation[Last /@ Sort /@ GatherBy[l[[All, 1 ;; 2]], #[[1]] &]]
ListContourPlot[l, RegionFunction -> (#2 < f[#1] &)]

Mathematica graphics

Edit

If you want a smoother curve, you could use for example whuber's method here for getting something similar to an "envolvent" curve:

l4 = {(#[[1]] - 14) 2 + 1, #[[2]]} & /@ l3;
nrow = 32;
i = Image[SparseArray[Flatten[Table[{i, IntegerPart@#1} -> #2, {i, 1, nrow}] & @@@ l4]]] 
                                                                                   // ImageAdjust

Mathematica graphics

{minima, maxima} = Flatten[Position[First[ImageData[#[i]]], 1]] & /@ {MinDetect, MaxDetect};

f1 = Interpolation[N@{(#[[1]] - 1)/2 + 14, #[[2]]} & /@ l4[[maxima]], InterpolationOrder -> 1]

f2[x_] = Max[f[x], f1[x]]

Quiet@ListContourPlot[l, RegionFunction -> (#2 < f2[#1] &)]

Mathematica graphics

Quiet@ListPlot3D[l, RegionFunction -> (#2 < f2[#1] &), 
                 ColorFunction -> "SouthwestColors", MeshFunctions -> {#3 &}]

Mathematica graphics

f = Interpolation[Last /@ Sort /@ GatherBy[l[[All, 1 ;; 2]], #[[1]] &]]
ListContourPlot[l, RegionFunction -> (#2 < f[#1] &)]

Mathematica graphics

Edit

If you want a smoother curve, you could use for example whuber's method here for getting something similar to an "envolvent" curve:

l4 = {(#[[1]] - 14) 2 + 1, #[[2]]} & /@ l3;
nrow = 32;
i = Image[SparseArray[Flatten[Table[{i, IntegerPart@#1} -> #2, {i, 1, nrow}] & @@@ l4]]] 
                                                                                   // ImageAdjust

Mathematica graphics

{minima, maxima} = Flatten[Position[First[ImageData[#[i]]], 1]] & /@ {MinDetect, MaxDetect};

f1 = Interpolation[N@{(#[[1]] - 1)/2 + 14, #[[2]]} & /@ l4[[maxima]], InterpolationOrder -> 1]

f2[x_] = Max[f[x], f1[x]]

Quiet@ListContourPlot[l, RegionFunction -> (#2 < f2[#1] &)]

Mathematica graphics

Quiet@ListPlot3D[l, RegionFunction -> (#2 < f2[#1] &), 
                 ColorFunction -> "SouthwestColors", MeshFunctions -> {#3 &}]

Mathematica graphics

added 782 characters in body
Source Link
Dr. belisarius
  • 116.2k
  • 13
  • 205
  • 456
Loading
Source Link
Dr. belisarius
  • 116.2k
  • 13
  • 205
  • 456
Loading