I am generating plots with the plots with plot legends. I want plot legends to be on the top of the figure as I can not sacrifice the horizontal space.
When the plot is generated with
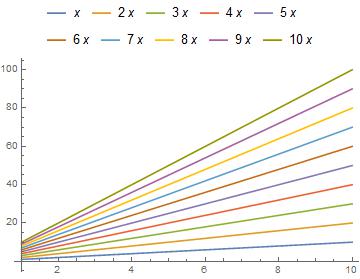
Plot[{x, 2 x, 3 x, 4 x, 5 x, 6 x, 7 x, 8 x, 9 x, 10 x}, {x, 1, 10}, PlotLegends -> Placed["Expressions", Top]]
the plot legends are aligned well at the top in two rows accroding to the image width as shown below.
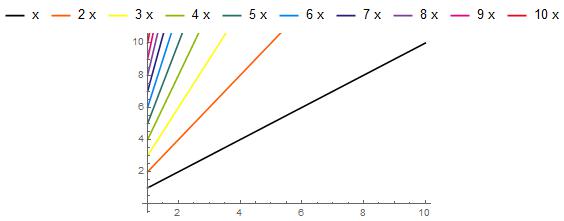
When plotting carried separately for each case and combined, they could not align according to the image width in spite of image width provided in each.
exp = Table[i x, {i, 1, 10, 1}]
{p1, p2, p3, p4, p5, p6, p7, p8, p9, p10} =  Table[Plot[exp[[i]], {x, 1, 0},
PlotLegends -> Placed[{ToString[exp[[i]]]}, Top],
PlotStyle -> ColorData[3, "ColorList"][[i]],
ImageSize -> 300], {i, 1, 10}];
Show[p1, p2, p3, p4, p5, p6, p7, p8, p9, p10]
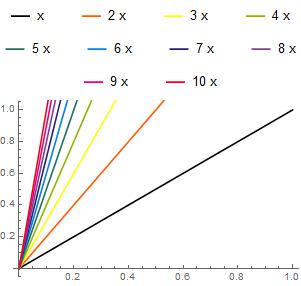
The plot of the second case is

I searched in stack exchange but could find similar problem asked before, but with contour plot q1 and q2. Please suggest a method to overcome the problem.
Thank you.
PS: I could not follow the first case as the plots in my case are from plot and listplot.
Update:
@Rom38 Thank you for your suggestion. But I could not succeed with that option with my knowledge. While looking mathematica documentation for legended, I got this idea.
legend1 = TableForm[{Table[
 LineLegend[{ColorData[3, "ColorList"][[i]]}, {ToString[
    exp[[i]]]}], {i, 1, 4}]}];
legend2 = TableForm[{Table[
 LineLegend[{ColorData[3, "ColorList"][[i]]}, {ToString[
    exp[[i]]]}], {i, 5, 8}]}];
legend3 = TableForm[{Table[
 LineLegend[{ColorData[3, "ColorList"][[i]]}, {ToString[
    exp[[i]]]}], {i, 9, 10}]}];
legend4 = TableForm[{legend1, legend2, legend3}, TableAlignments -> Center] (*This generated the desired form for the legends*)
The plots are generated using
plots = Table[Plot[exp[[i]], {x, 1, 0},PlotStyle -> ColorData[3, "ColorList"][[i]], ImageSize -> 300], {i, 1, 10}];
Legended[Show[plots], Placed[legend4, Top]]
I know that this not a straight path for solving this problem.


