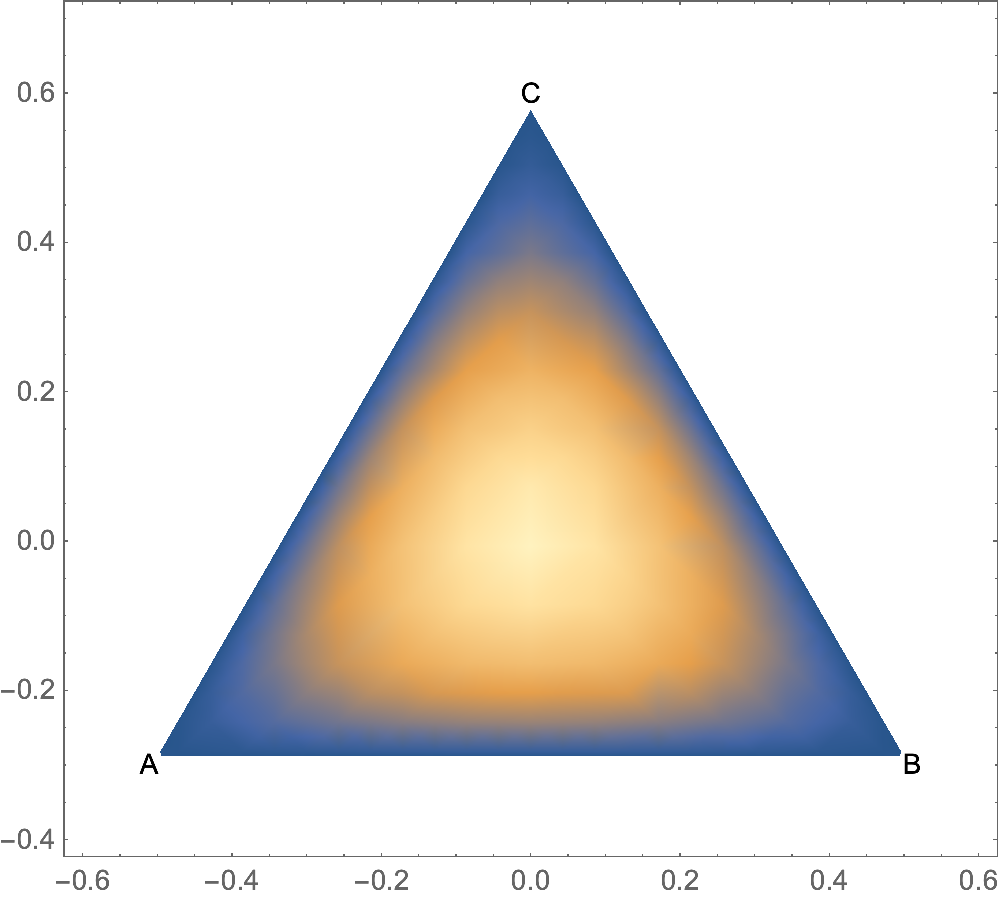
Without using any transformations, you have
$$ A = \frac13 - x - \frac{y}{\sqrt{3}}\\ B = \frac13 + x - \frac{y}{\sqrt{3}}\\ C = \frac13 + \frac{2 y}{\sqrt{3}} $$
In this form, they span the ranges $[0,1]$ over an equilateral triangle with unit edges, and satisfy $A+B+C=1$. In what follows I'll use $a$, $b$, $c$ instead of the capital letters because it's not a good idea to use capital letters for your own definitions in Mathematica.
Plotting your function, you need to multiply these with $\pi$ to get your desired range.
Here's a very simplistic way of plotting that does not generate any tick marks. It is mostly for getting a quick overview. If you want proper tick marks you need to follow some of the other recommendations, for example on question 39733. Also, MeshFunctions can give interesting meshes when combined with the effective coordinates $a$, $b$, $c$.
f[a_, b_, c_] = Sin[π*a/2] Sin[π*b/2] Sin[π*c/2];
DensityPlot[f[1/3-x-y/Sqrt[3], 1/3+x-y/Sqrt[3], 1/3+2y/Sqrt[3]],
  {x, -0.6, 0.6}, {y, -0.4, 0.7},
  RegionFunction -> Function[{x, y}, 0<=1/3-x-y/Sqrt[3]<=1 && 0<=1/3+x-y/Sqrt[3]<=1 && 0<=1/3+2y/Sqrt[3]<=1],
  AspectRatio -> Automatic,
  Epilog -> {Text["A", {-1/2, -1/(2 Sqrt[3])}, {Sqrt[3]/2, 1/2}],
             Text["B", {1/2, -1/(2 Sqrt[3])}, {-Sqrt[3]/2, 1/2}],
             Text["C", {0, 1/Sqrt[3]}, {0, -1}]}]
Here is what happens if we set the function $f(a,b,c)$ to either $a$, $b$, or $c$: you can see the behavior of these coordinates,


