added information
Source Link
David Keith
  • 4.7k
  • 1
  • 15
  • 31

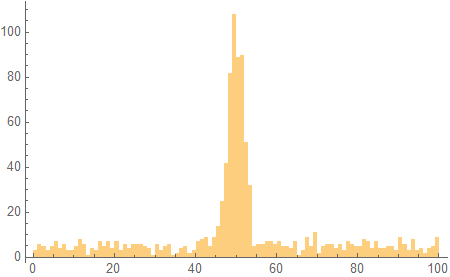
You are on the right track. Notice that in your mixture, the uniform distribution spans [0,2], but the Normal distribution has a mean of 3. Here is another mixture. Just adjust the distribution parameters as needed:

dist = MixtureDistribution[{1, 1},
   {
    UniformDistribution[{0, 100}],
    NormalDistribution[50, 2]
    }
   ];

Histogram[RandomVariate[dist, 1000], {1}]

enter image description here

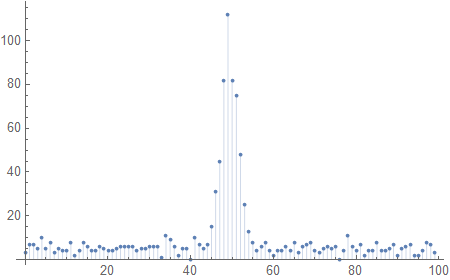
Edit: If you want data, you can use some variant of HistogramList:

{binBoundaries, counts} = 
  HistogramList[RandomVariate[dist, 1000], {1}];

ListPlot[Transpose[{Most[binBoundaries], counts}], PlotRange -> All, 
 Filling -> Axis]

enter image description here

You are on the right track. Notice that in your mixture, the uniform distribution spans [0,2], but the Normal distribution has a mean of 3. Here is another mixture. Just adjust the distribution parameters as needed:

dist = MixtureDistribution[{1, 1},
   {
    UniformDistribution[{0, 100}],
    NormalDistribution[50, 2]
    }
   ];

Histogram[RandomVariate[dist, 1000], {1}]

enter image description here

Edit: If you want data, you can use some variant of HistogramList:

{binBoundaries, counts} = 
  HistogramList[RandomVariate[dist, 1000], {1}];

ListPlot[Transpose[{Most[binBoundaries], counts}], PlotRange -> All, 
 Filling -> Axis]
enter image description here

added information
Source Link
David Keith
  • 4.7k
  • 1
  • 15
  • 31

You are on the right track. Notice that in your mixture, the uniform distribution spans [0,2], but the Normal distribution has a mean of 3. Here is another mixture. Just adjust the distribution parameters as needed:

dist = MixtureDistribution[{1, 1},
   {
    UniformDistribution[{0, 100}],
    NormalDistribution[50, 2]
    }
   ];

Histogram[RandomVariate[dist, 1000], {1}]

enter image description here

You are on the right track. Just adjust the distribution parameters as needed:

dist = MixtureDistribution[{1, 1},
   {
    UniformDistribution[{0, 100}],
    NormalDistribution[50, 2]
    }
   ];

Histogram[RandomVariate[dist, 1000], {1}]

enter image description here

You are on the right track. Notice that in your mixture, the uniform distribution spans [0,2], but the Normal distribution has a mean of 3. Here is another mixture. Just adjust the distribution parameters as needed:

dist = MixtureDistribution[{1, 1},
   {
    UniformDistribution[{0, 100}],
    NormalDistribution[50, 2]
    }
   ];

Histogram[RandomVariate[dist, 1000], {1}]

enter image description here

Source Link
David Keith
  • 4.7k
  • 1
  • 15
  • 31

You are on the right track. Just adjust the distribution parameters as needed:

dist = MixtureDistribution[{1, 1},
   {
    UniformDistribution[{0, 100}],
    NormalDistribution[50, 2]
    }
   ];

Histogram[RandomVariate[dist, 1000], {1}]

enter image description here