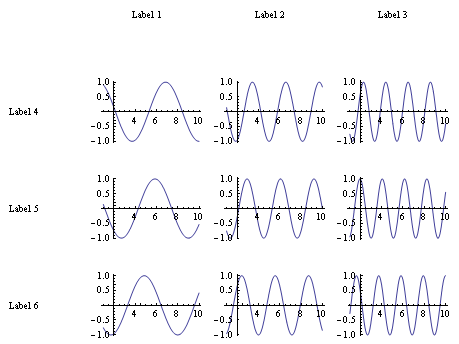
Here is an option:
plots = Table[Table[Plot[Sin[i x + j], {x, 1, 10}], {i, 3}], {j, 3}];
xlabels = {"", "Label 1", "Label 2", "Label 3"};
ylabels = {"Label 4", "Label 5", "Label 6"};
GraphicsGrid[Join[{xlabels}, Transpose[Join[{ylabels}, Transpose[plots]]]]]
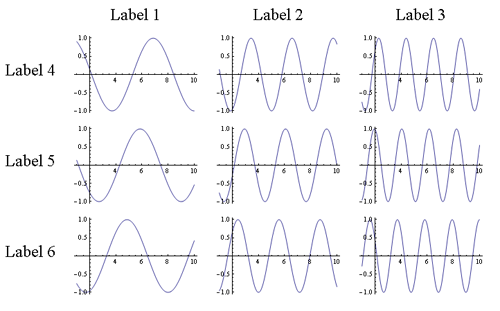
Updated with a slightly prettier option:
xlabels = Text[Style[#, Large]] & /@ {"", "Label 1", "Label 2", "Label 3"};
ylabels = Text[Style[#, Large]] & /@ {"Label 4", "Label 5", "Label 6"};
Grid[Join[{xlabels}, Transpose[Join[{ylabels}, Transpose[plots]]]], Spacings -> {2, 1}]


