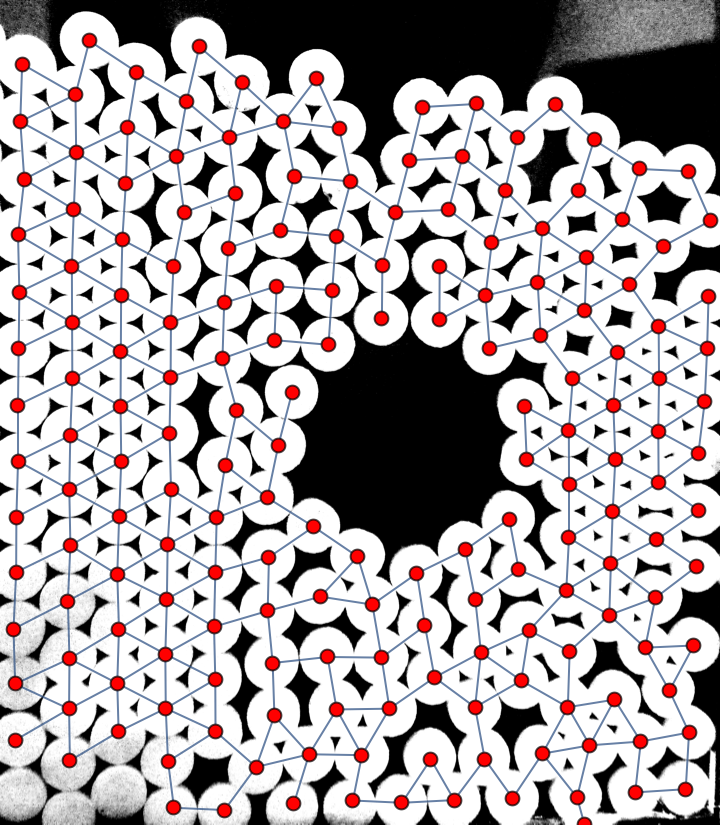
(* Perform image manipulation steps, feeding from one to another. *)
(* You can replace a "//" with "// Echo //" to see an intermediate value. *)
MorphologicalBinarize[img, 0.9] // Blur[#, 40] & //
    Binarize[#, 0.9] & // HitMissTransform[#, DiskMatrix[55]] & //
  (* Measure component centroids on the manipulated image. *)
  ComponentMeasurements[#, "Centroid"][[All, 2]] & //
 Function[v,
  (* Select valid edges from all pairs of components:
     - those whose edge length is less than 300, and
     - at most 4 values of 400 sampled along the edge have a value < 0.25 *)
  Select[Subsets[v, {2}],
     EuclideanDistance @@ # < 300 && Count[
        Table[
         Min@PixelValue[imgCount[Table[Min@PixelValue[img, {t, 1 - t}.#], {t, 0, 1, 0.0025}],
          0.0025}], _?(# < 0.25 &)] < 5 &] //
   (* Overlay the graph on top of the original image. *)
   Show[img,
     (* Construct a graph object with vertices on component centroids,
        and edges as filtered by the Select expression. *)
     Graph[v, UndirectedEdge @@@ #, VertexCoordinates -> v,
      VertexStyle -> Red, VertexSize -> 1/2], ImageSize -> Medium] &]
g = (MorphologicalBinarize[img, 0.9] // Blur[#, 40] & //
      Binarize[#, 0.9] & // HitMissTransform[#, DiskMatrix[55]] & //
    ComponentMeasurements[#, "Centroid"][[All, 2]] & //
   Function[v,
    Select[Subsets[v, {2}],
       EuclideanDistance @@ # < 300 &&
        Count[Table[
           Min@PixelValue[imgCount[Table[Min@PixelValue[img, {t, 1 - t}.#], {t, 0, 1, 0.0025}],
            0.0025}], _?(# < 0.25 &)] < 5 &] //
     Graph[v, UndirectedEdge @@@ #, VertexCoordinates -> v] &])


